Annotations
Contents
Introduction
Annotations can help explain narratives in your charts and allow users to provide context and highlight important insights directly in the chart.
KeyLines annotations are readable at any chart size and zoom level. You can style them to fit your application design, and also integrate them with your user interface so that chart users don't need to use external tools for sharing insights.
To provide more context in documents or presentations, you can export annotated charts with chart.export().
Learn more in our annotation demos and the Annotations API Reference.
Adding annotations
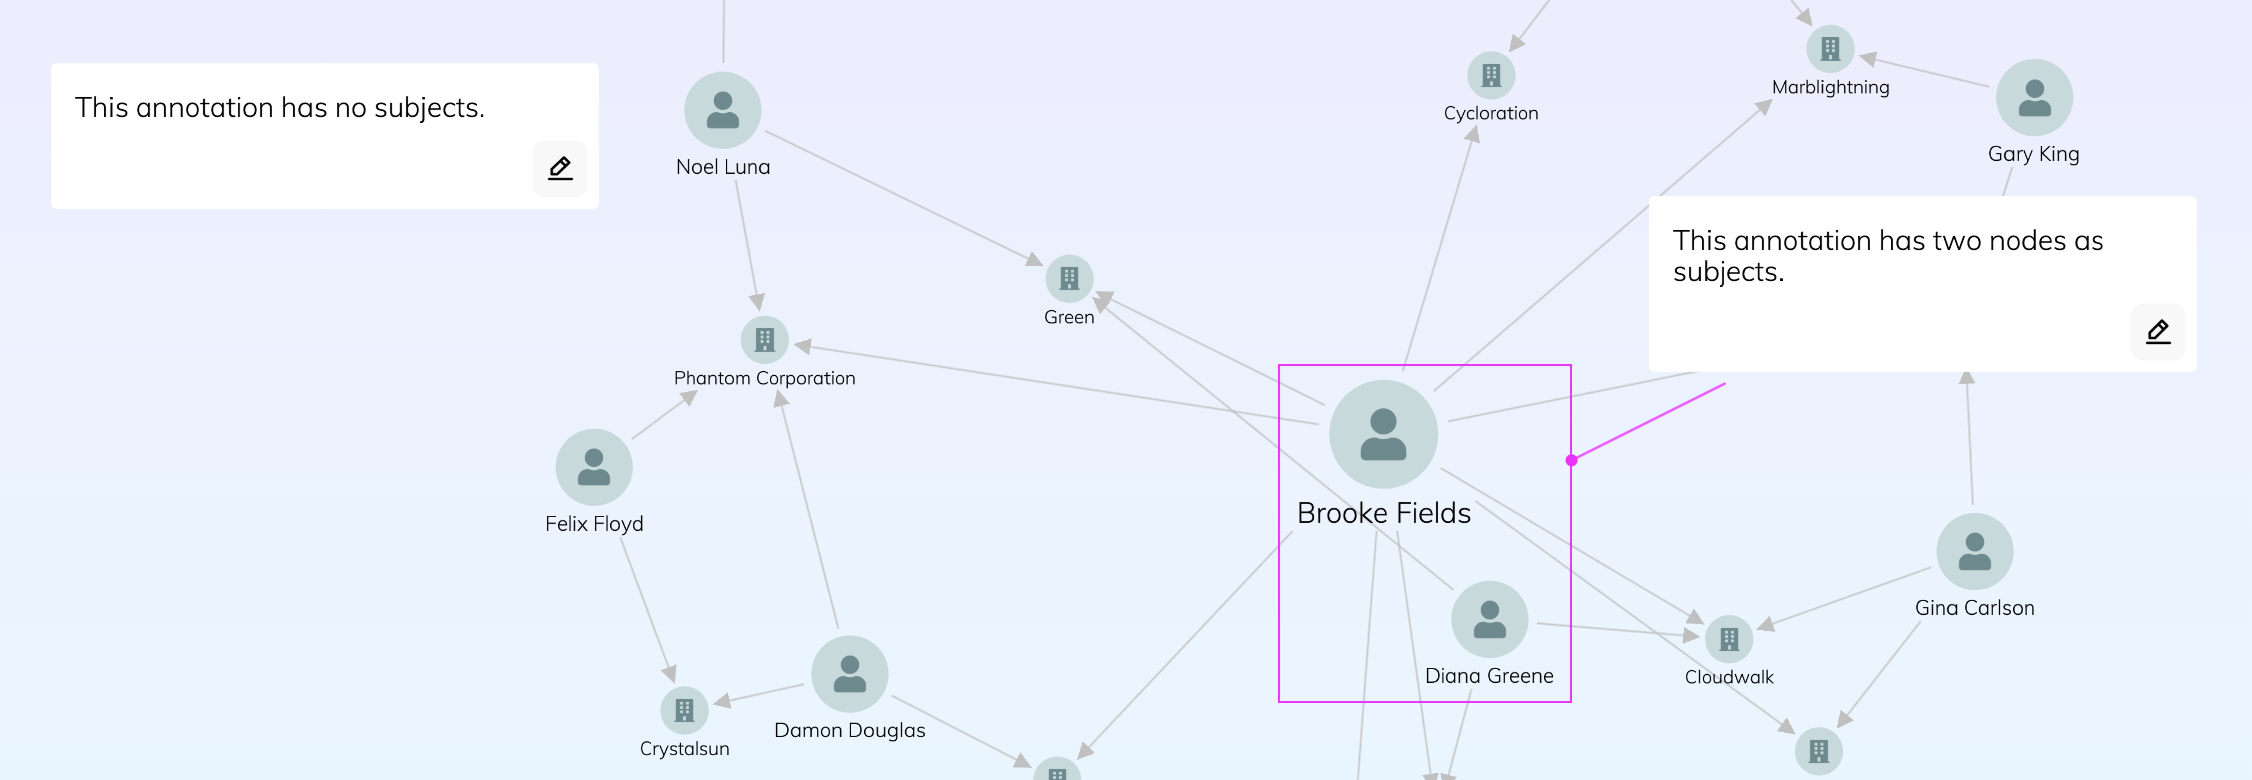
In the chart, you can annotate nodes, links and open and closed combos. You can also create free-standing annotations without any subjects.
Annotations can have a single or multiple subjects, and even annotate a combination of nodes, links and combos.
Annotations are added as special type of chart item in the
items array.
The subject
array is set differently for annotations with and without subjects:
let data = {
  type: 'LinkChart',
  items: [
    { id: 'node1', type: 'node', c: '#ff00ff' },
    {
      id: 'annotation1',
      type: 'annotation',
      subject: 'node1',                                // node1 is annotation subject
      t: { t: 'Annotation with subject' },
    },
    {
      id: 'annotation2',
      type: 'annotation',
      t: { t: 'Annotation without subject' },
      subject: [],                                     //  an empty array indicates no subjects
      position: { x: 350, y: -50 },   //  no-subject annotation requires coordinate positioning
    },
  ],
};
Annotations without subjects still require the subject array to be set.
You can set it to an empty array.
Annotations are loaded into the chart for example using chart.load(), chart.merge(), chart.expand() or chart.setItem().
If your application code contains logic checking whether a chart
item
is either a node or a link (
if (item.type === 'node') { etc } ),
introducing annotations into your code
may require changes to also consider annotations.
Positioning
KeyLines annotations are drawn in their own separate layer on top of the chart. They do not scale during zooming and instead remain readable at every zoom level. There are two ways of positioning annotations:
Subject-relative positioning
You can position annotations relative to their subjects
using the following properties in the position object:
- the angle relative to their subjects, either in compass points or in degrees
- the distance from their subjects in view coordinates
When a layout is run or when their subjects are repositioned, annotations also move to keep their position relative to their subjects. Manually dragging the annotation updates its position.
Subject-relative annotations are drawn when at least one of their subjects is visible in the chart. If subjects are inside a combo, annotations are only drawn when the combo is open.
You can use the chart.getRelativeAnnotationPosition() function to get subject-relative positions of annotations.
World-coordinate positioning
You can position any annotation (with or without subjects) on the chart in world coordinates by setting the
x and
y properties
in the position object.
When positioned using coordinates, annotations remain fixed even during changes to the chart such as zooming, panning, items moving or subject changing. Manually dragging the annotation updates its position.
World-coordinate annotations do not depend on subjects for positioning and are drawn even if no subjects are visible in the chart.
You can use the chart.getWorldAnnotationPosition() function to get world-coordinate positions of annotations.
If you want to position annotations using view coordinates,
you can use the
chart.viewCoordinates() function
to convert world coordinates into view coordinates.
Styling

A default annotation with subjects has two main parts:
- A body with text, images, font icons or custom user controls, styled in the annotation properties
- A connector that relates the annotation to its subject(s), styled in the connectorStyle object
The connector is made of three parts:
- A line or lines pointing to the subject(s)
- An optional subjectEnd decoration, which can be a dot or an arrow
- An optional container around node or combo subjects, which can be a circle or a rectangle
The
c (colour),
w (width) and
ls (line style)
options of connectorStyle style the whole connector.
Setting the
w option to 0
hides the connector and creates an annotation that isn't visibly connected to subjects
but stays in a relative position to them.
The styling of body in the annotation properties includes setting custom dimensions, fill colour, borders, or adding multiple labels and multiple glyphs. Take a look at the Advanced Annotation Styles demo to explore various examples and levels of styling.
Both chart.setProperties() and chart.animateProperties() can be used to set annotation properties.
See more about individual annotation parts in the Annotation Basics demo.
Custom user controls
You can add custom user controls to annotations to integrate them into your application's user workflow.
Using the KeyLines API, you can add labels (t) and glyphs (g) as buttons or toggles and respond to chart events triggered by interacting with the buttons:
// example click handler where the 2nd label is a delete button

const clickHandler = ({ subItem, id }) => {
  const item = chart.getItem(id);
  if (
    item &&
    item.type === 'annotation' &&   // if an item is an annotation
    subItem.type === 'label' &&     // and the clicked item is a label
    subItem.index === 1             // and the label has index of 1 in the array (2nd label)
  ) {
    // code for delete button here
  }
};
See an example of this in our Advanced Annotation Styles demo.
You can also create annotations with user-editable text fields or any other custom elements by overlaying your own HTML elements over KeyLines annotations. For more details, have a look at the User-Created Annotations demo.
Filtering
Subject-relative annotations are drawn when at least one of their subjects is visible in the chart.
World-coordinate annotations are drawn even if no subjects are visible in the chart.
This means that annotations without subjects are always visible as as they can only be positioned using world coordinates.
You can control the visibility of annotations independently of their subjects using the following APIs:
- items - add or remove annotation from the chart items
- hi - whether the specific annotation is hidden in the chart
- chart.filter() - show or hide annotation if
typeis "annotation" - chart.show() / chart.hide() - show or hide annotations with the id specified
Annotations with subjects also inherit these states from their subjects:
- hi - subject-relative annotations are hidden if all of their subjects are hidden.
- chart.filter() - iterates over subjects, subject-relative annotations are hidden if all of their subjects are hidden.
Special behaviour
While annotations are loaded into the chart just like nodes and links, they are a special type of always-readable chart item that are not considered as items by the layout algorithms. As a result, some of their behaviour is different from other chart items:
- Annotations cannot be selected.
- Annotations cannot be foregrounded or backgrounded.
- Annotations are not shown on a Leaflet map.