3.8 Release Notes21 November 2017
NEW FEATURESENHANCEMENTSBUG FIXESDEMO CHANGES
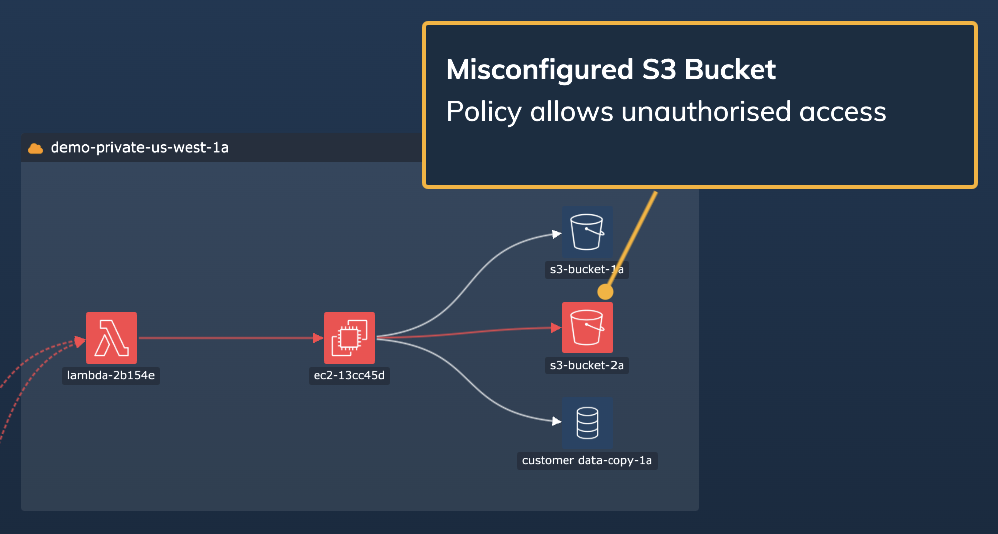
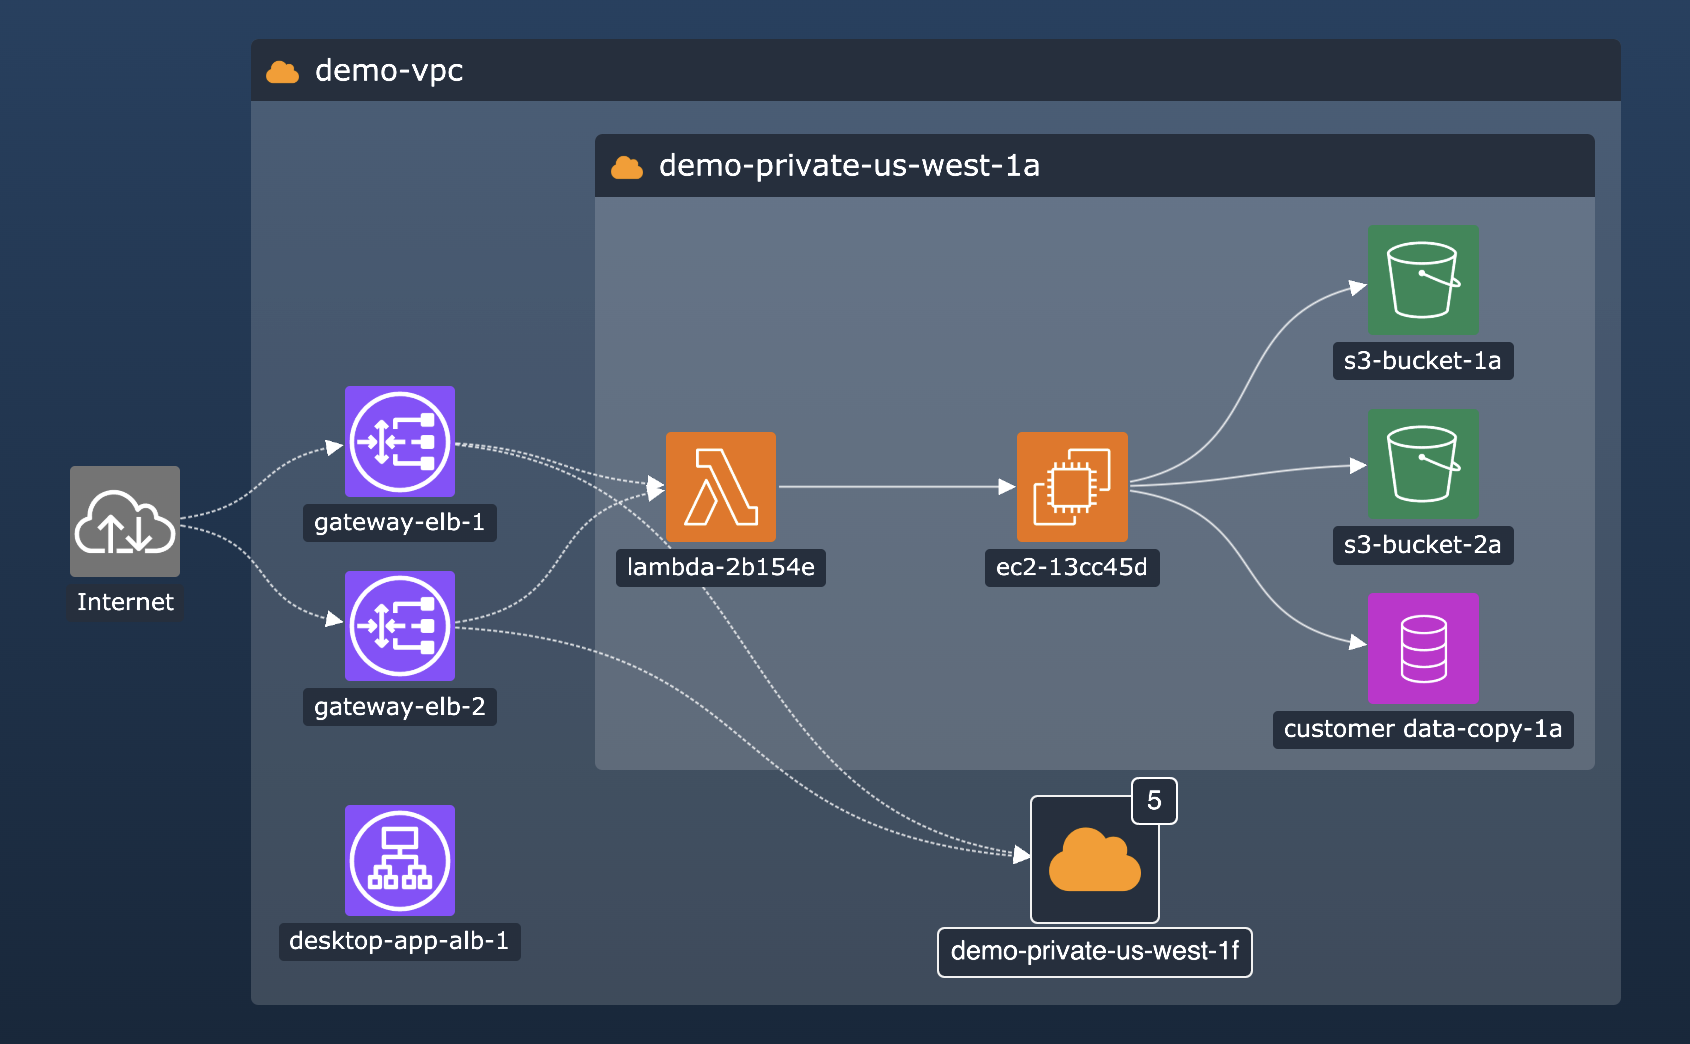
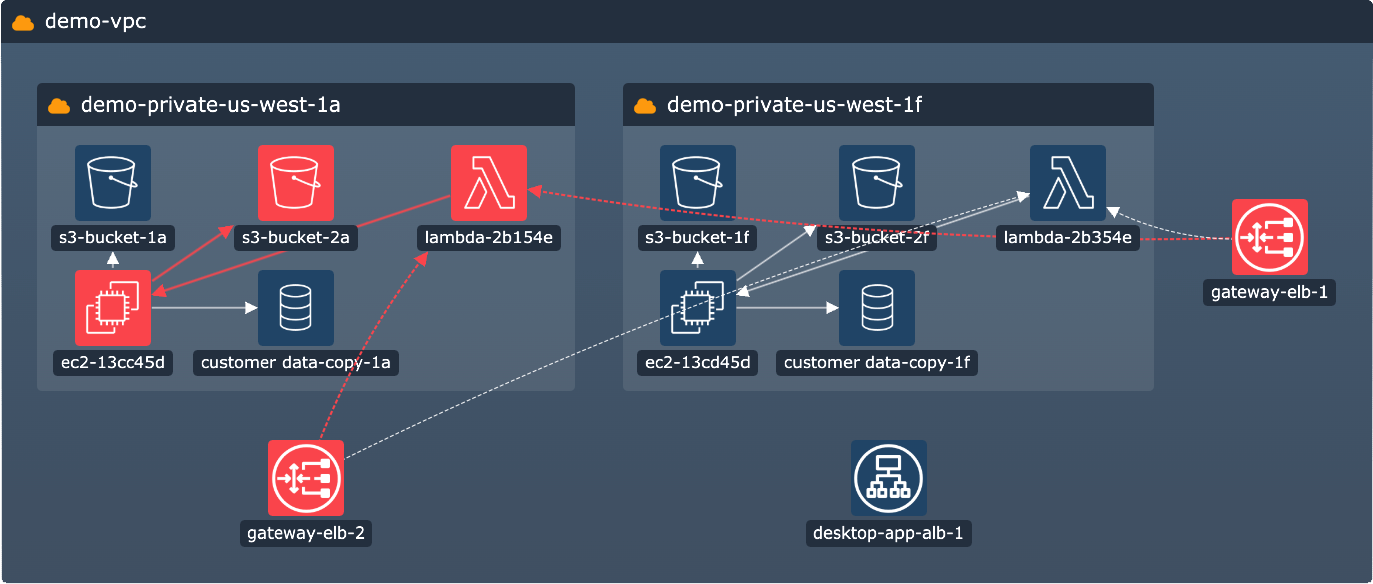
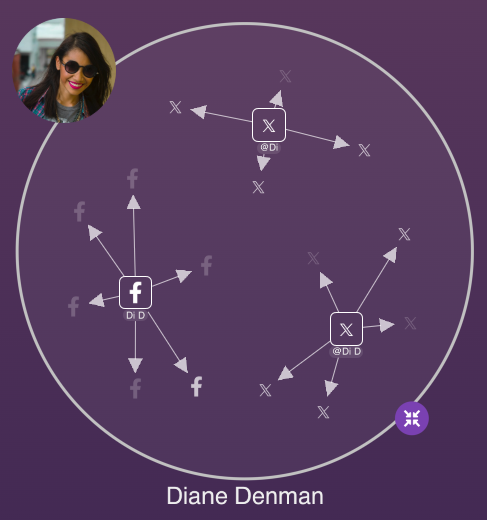
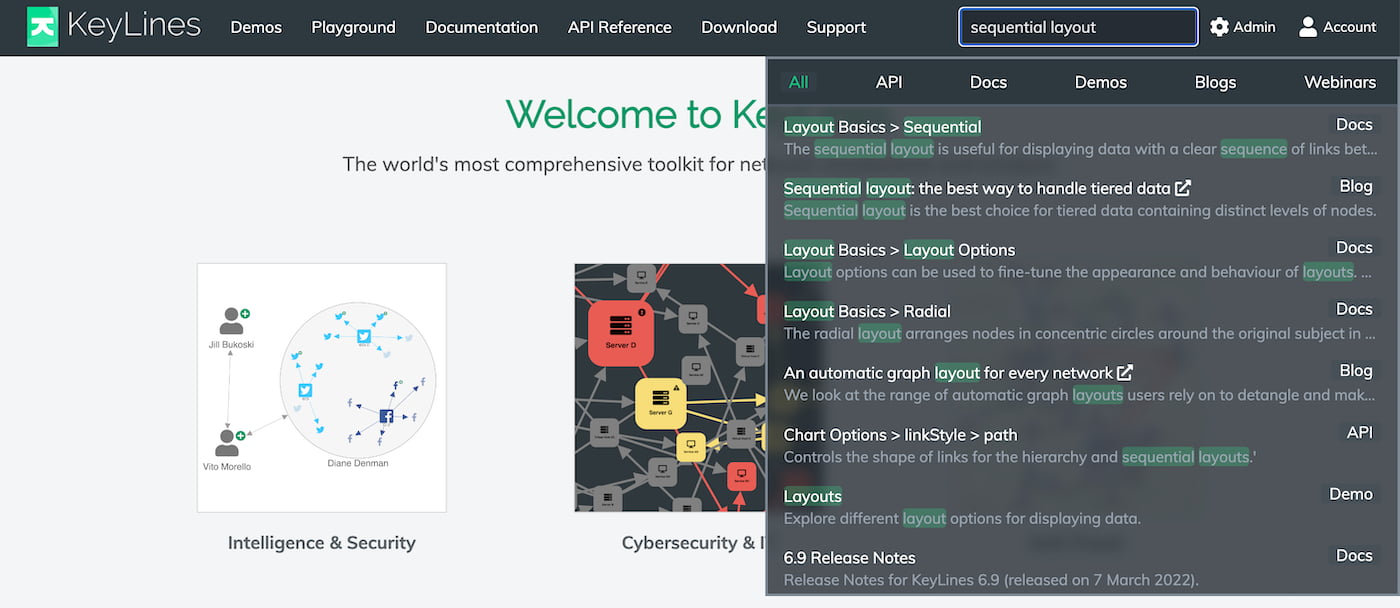
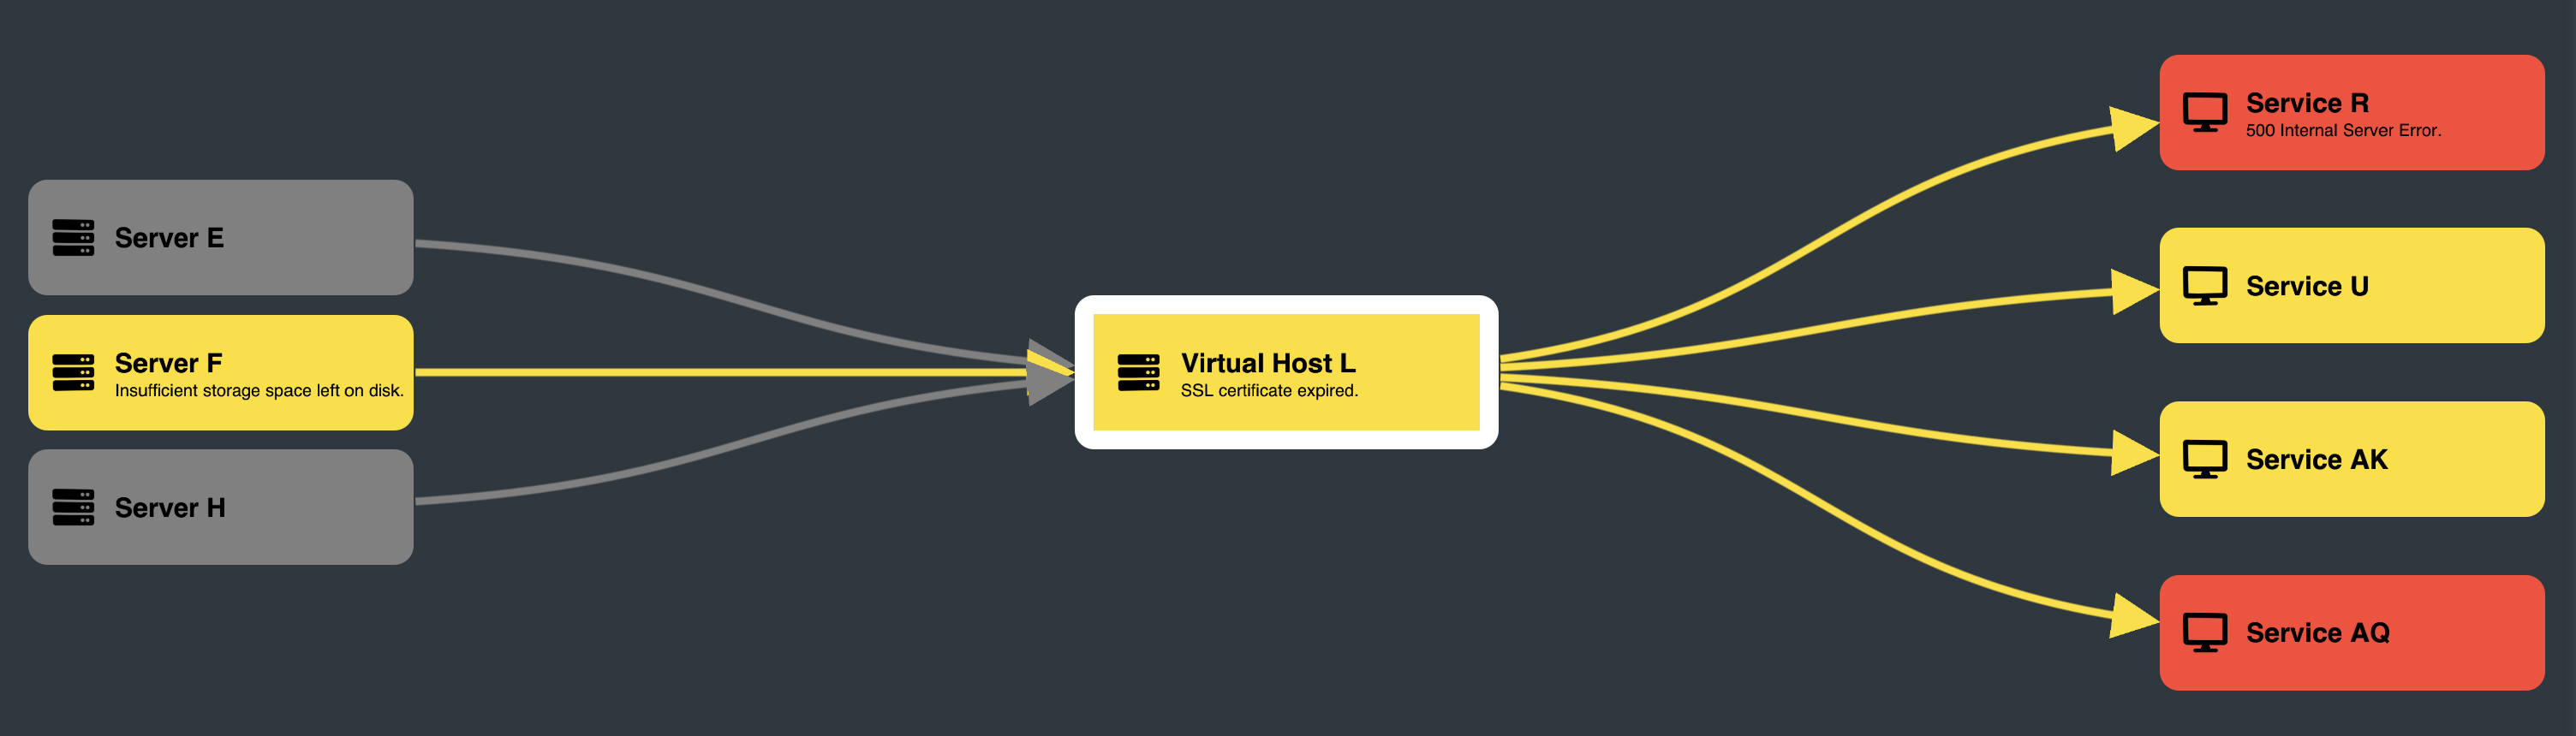
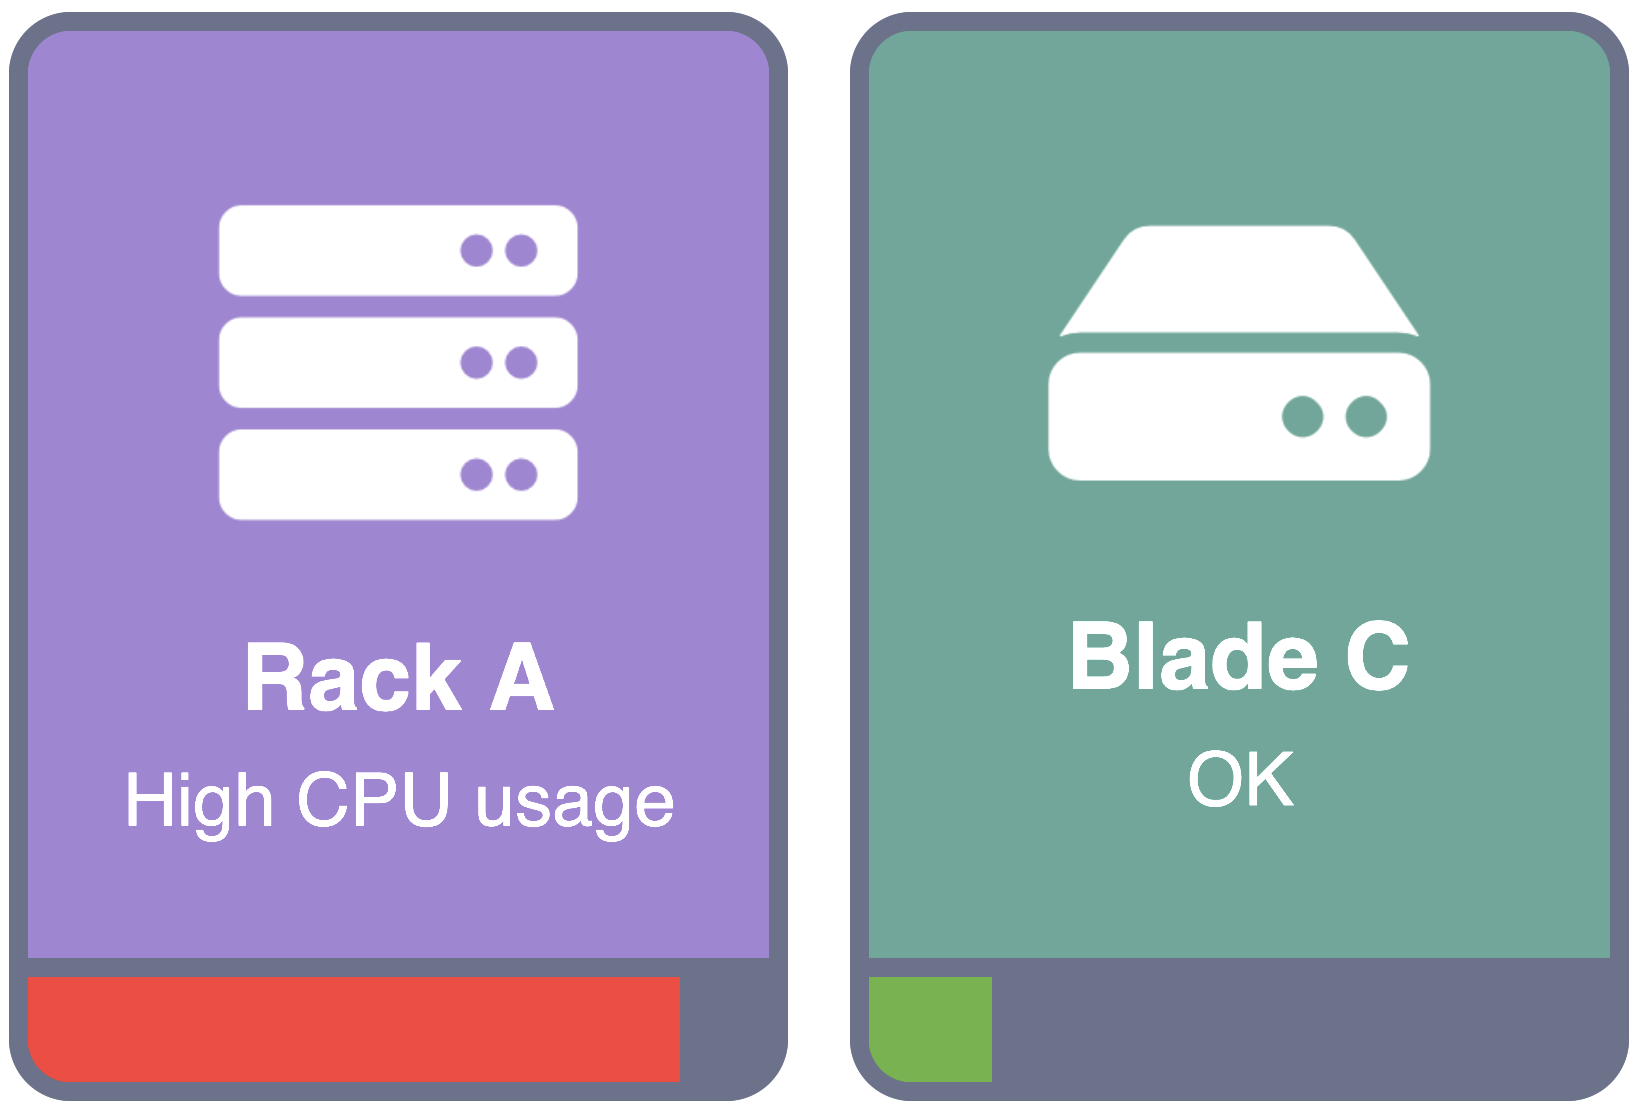
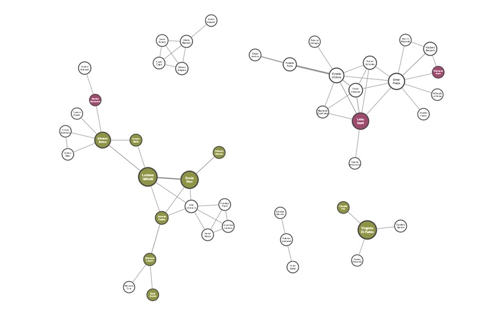
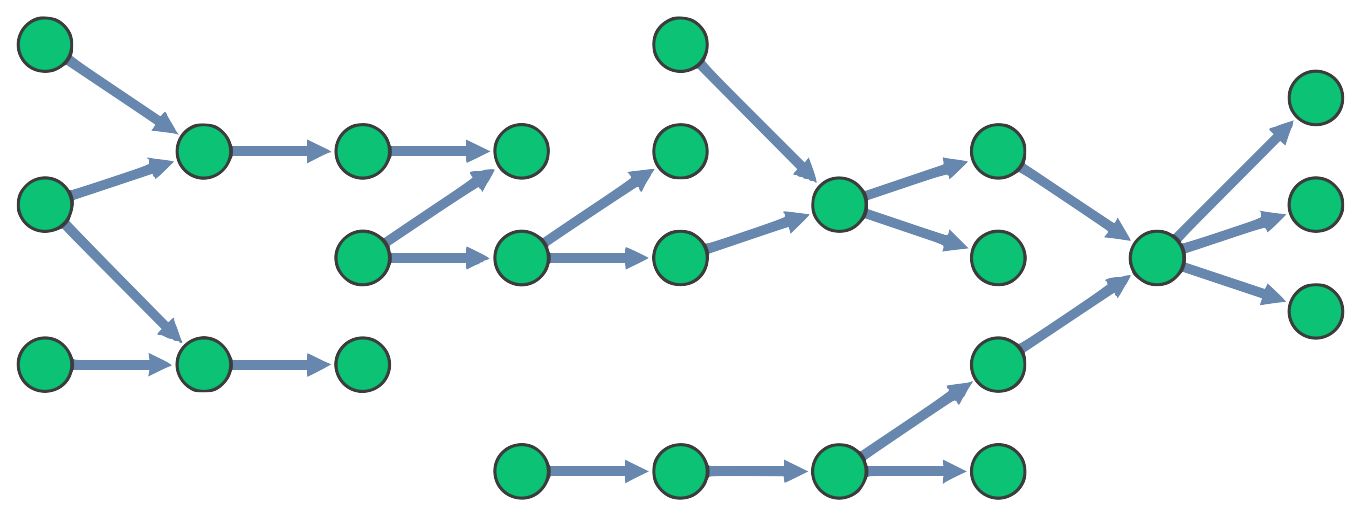
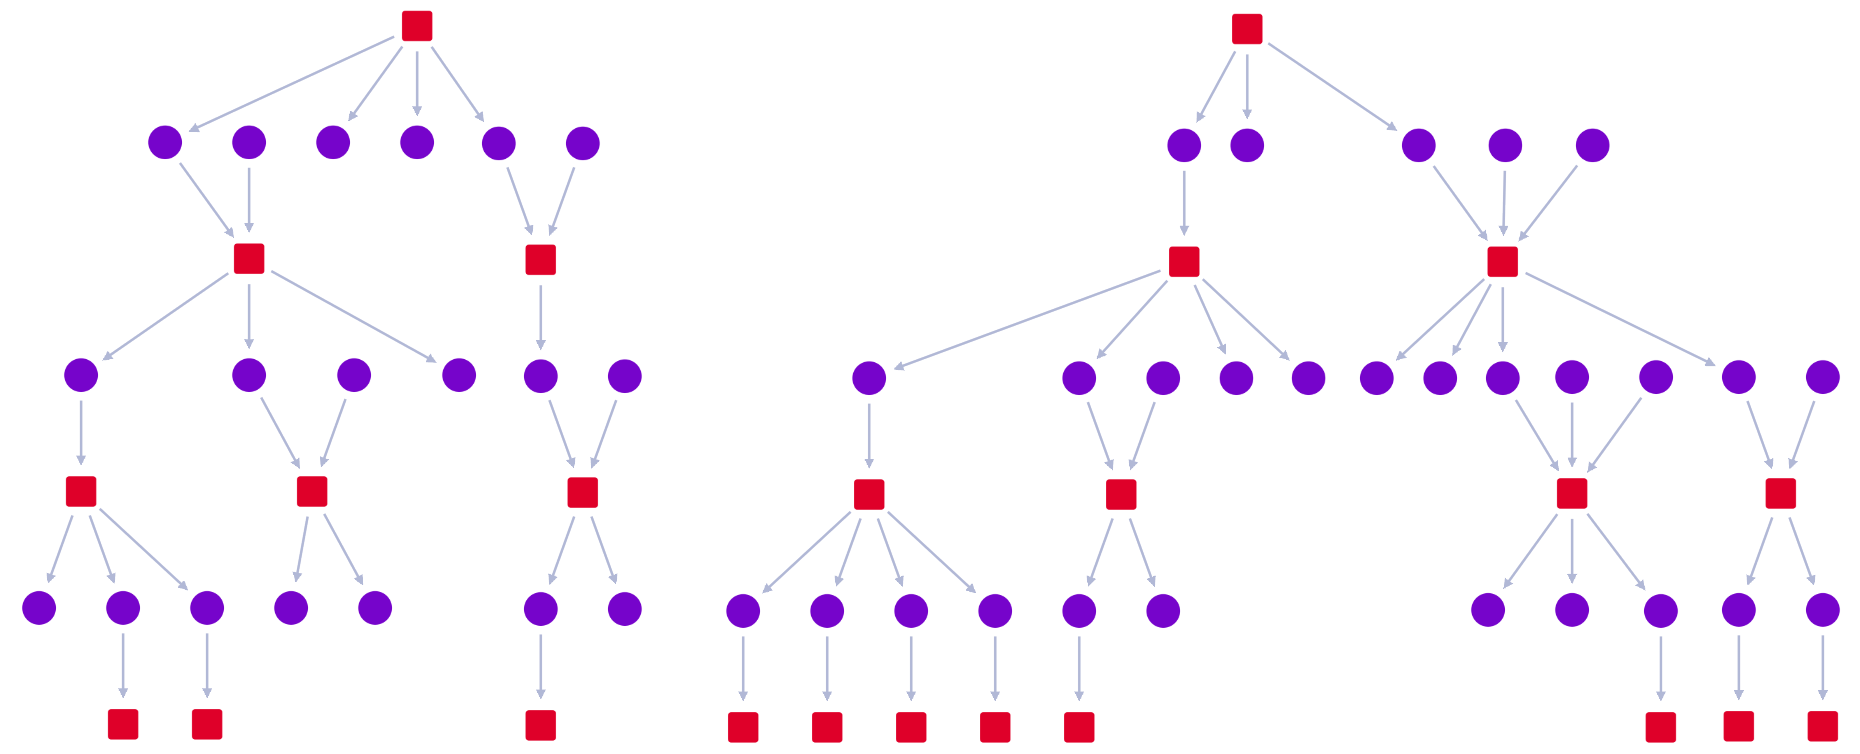
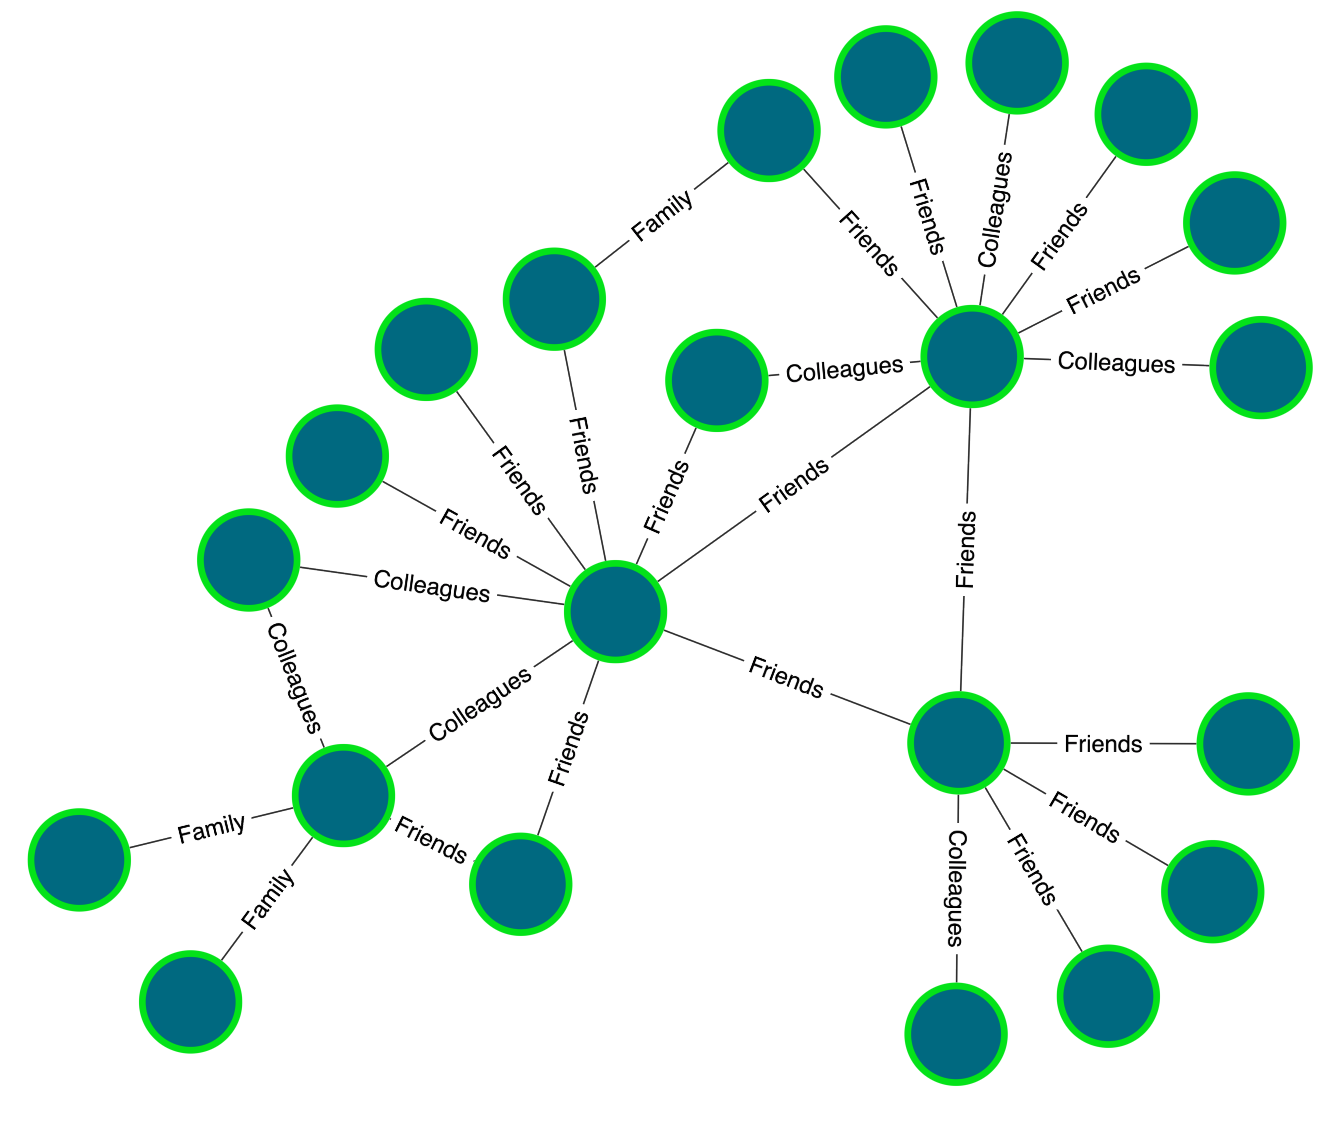
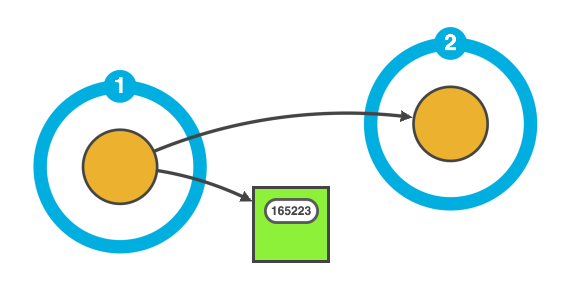
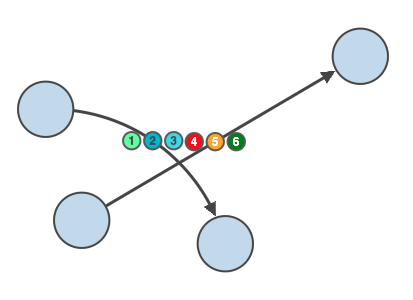
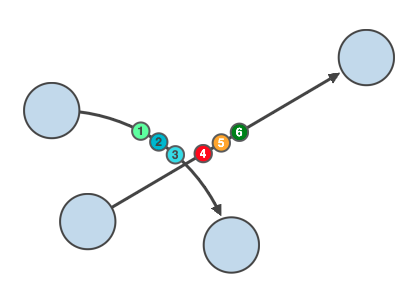
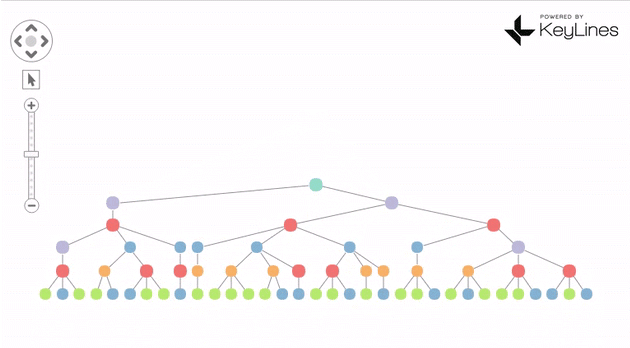
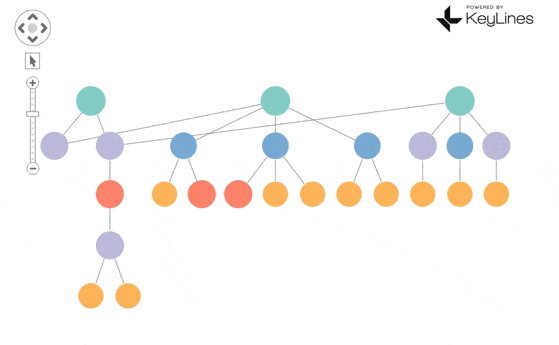
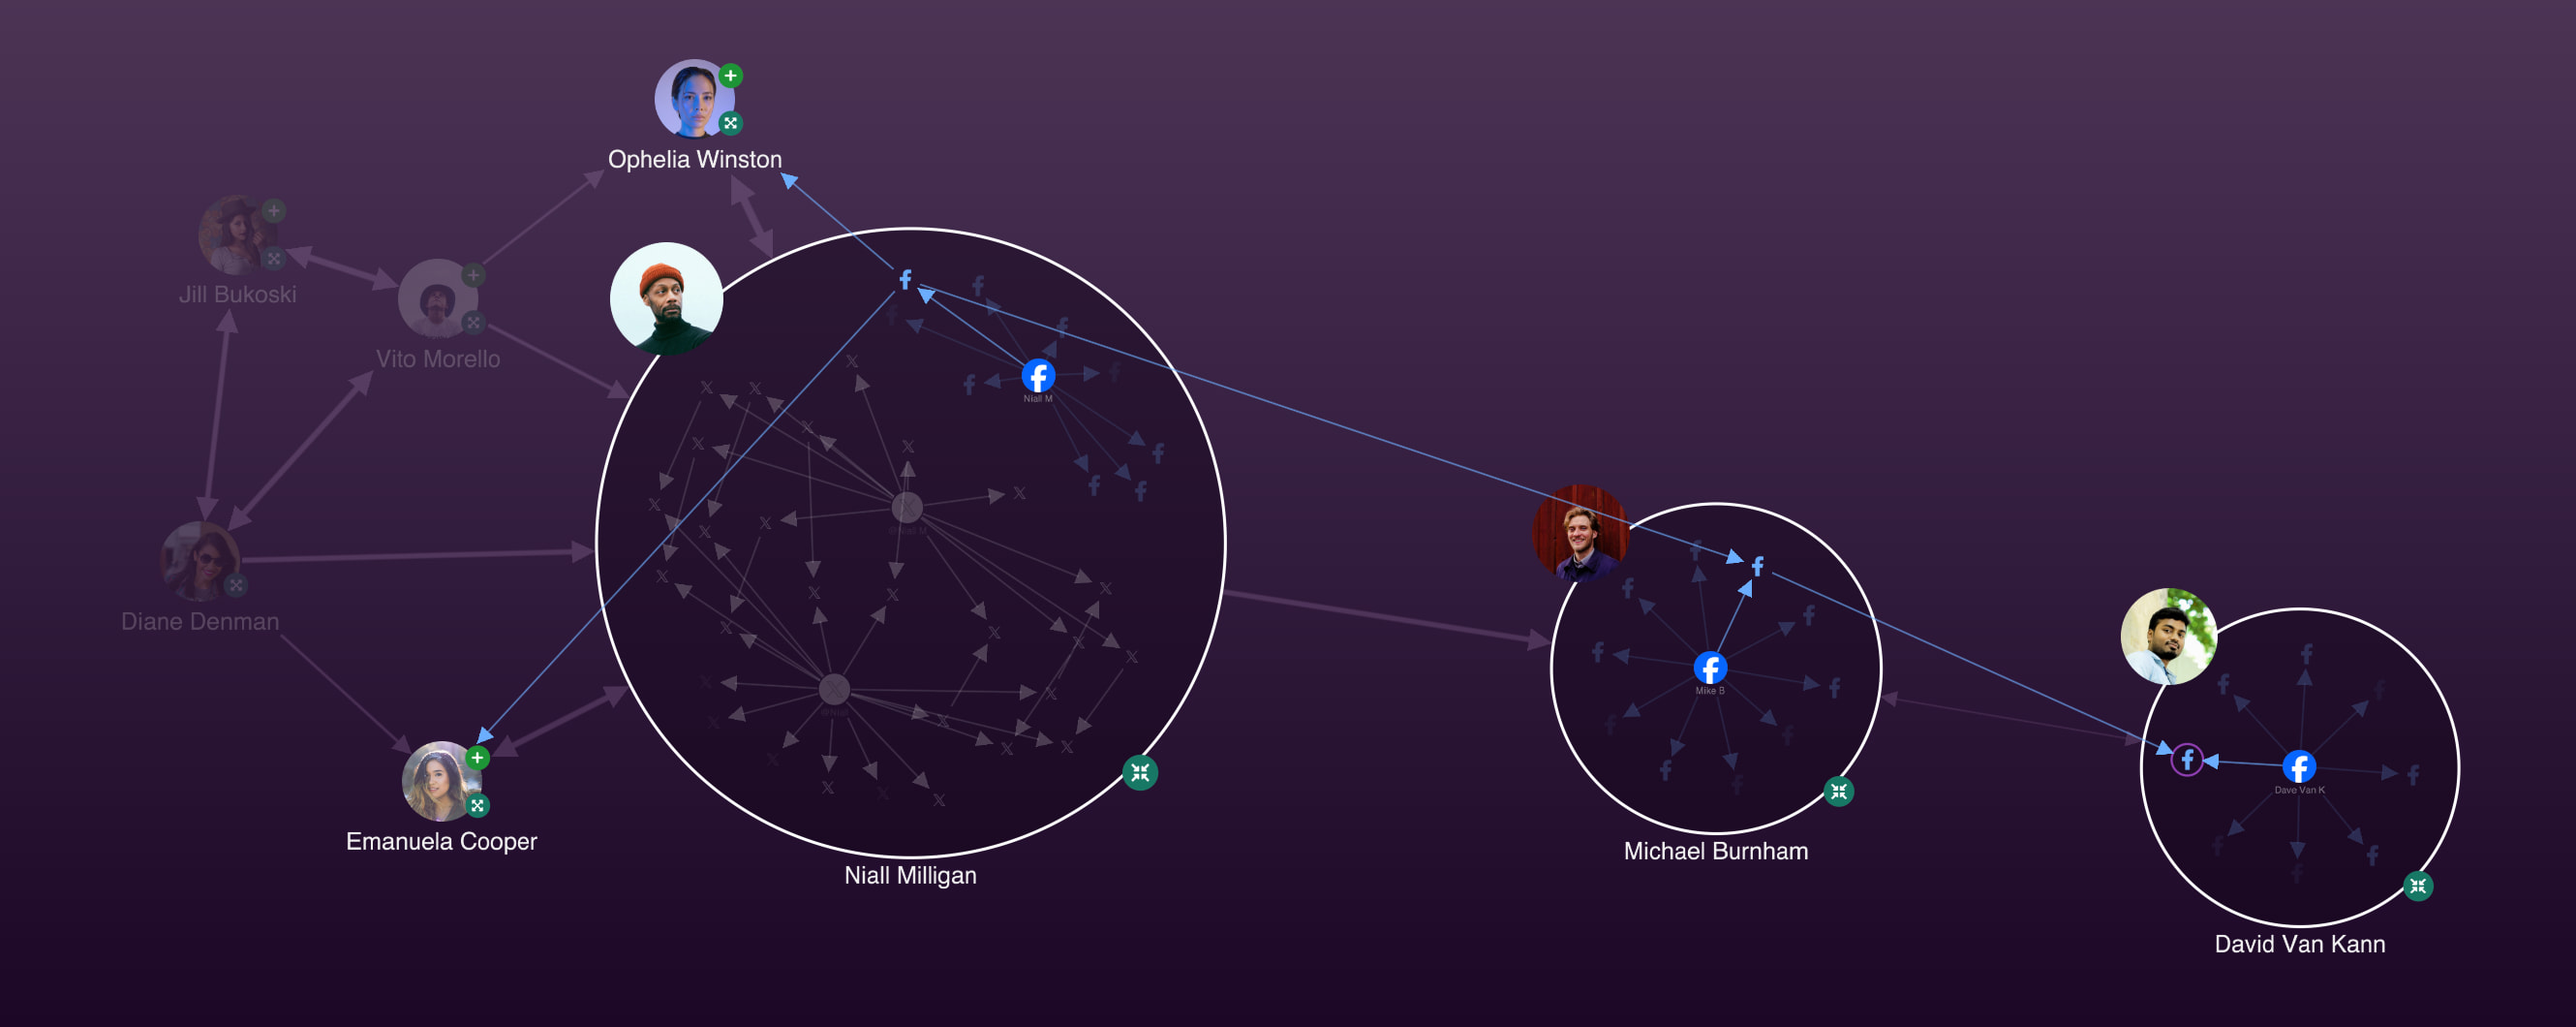
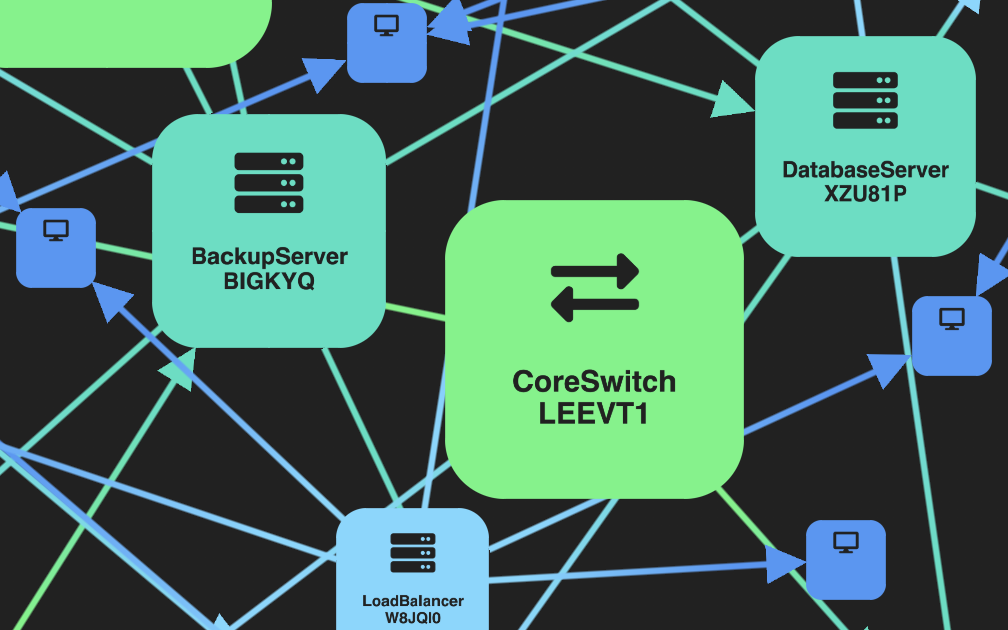
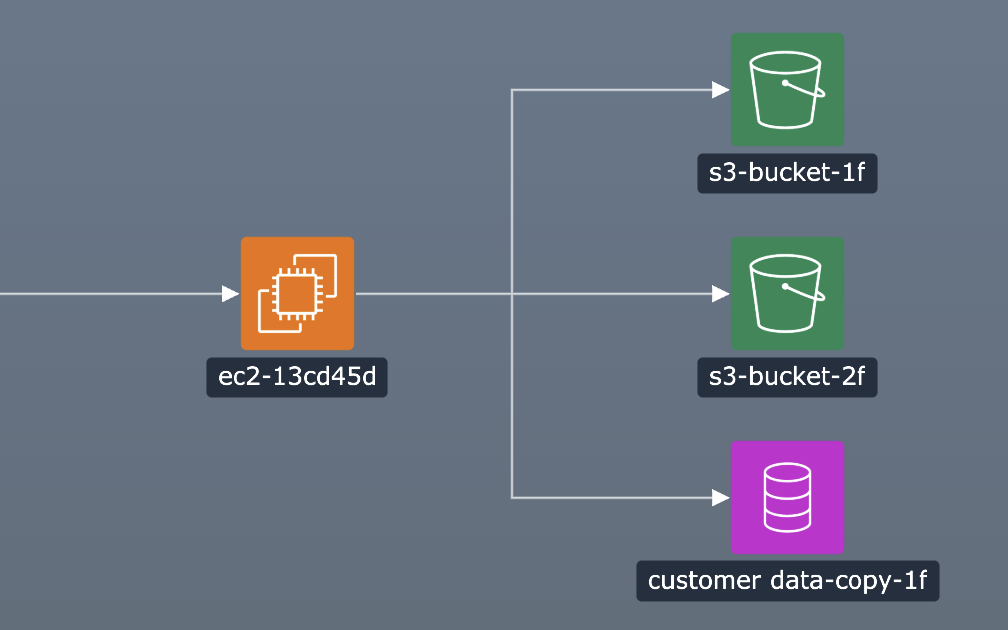
New sequential layout
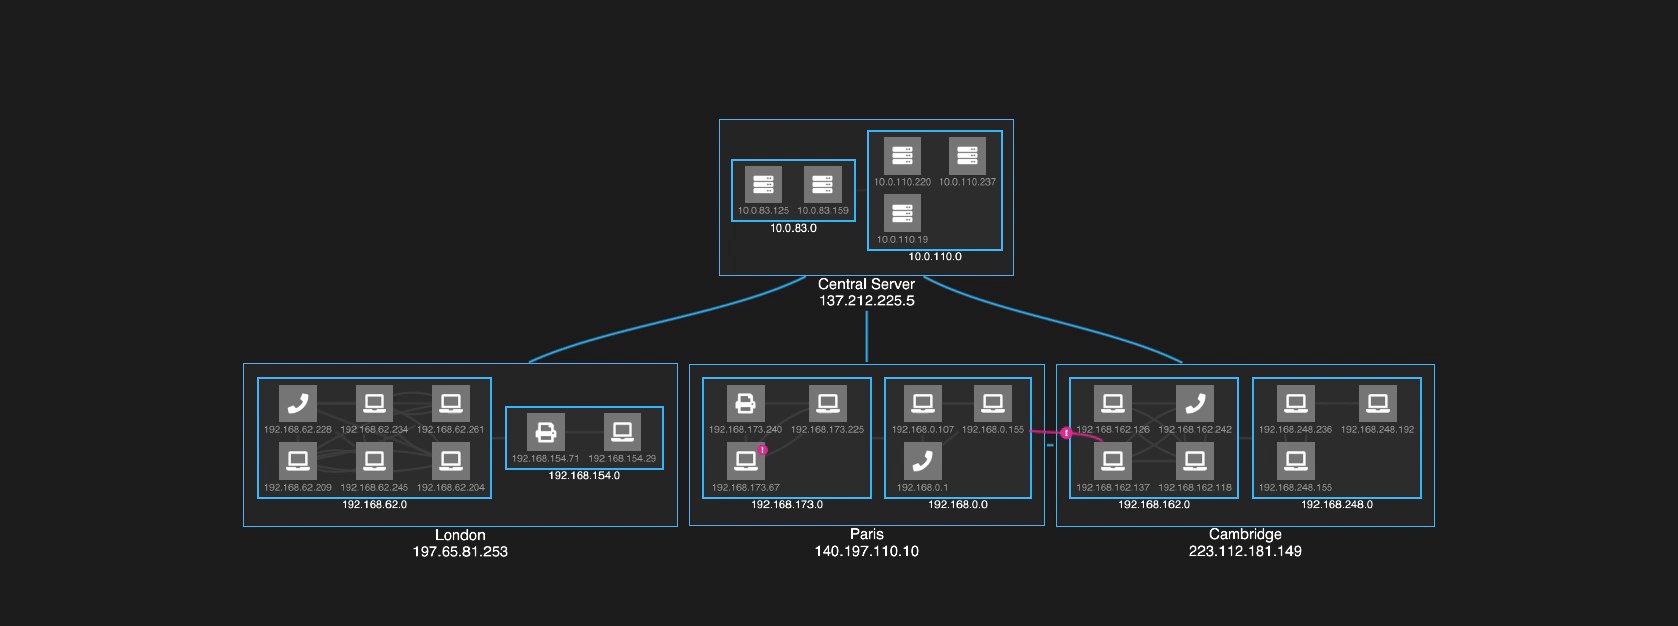
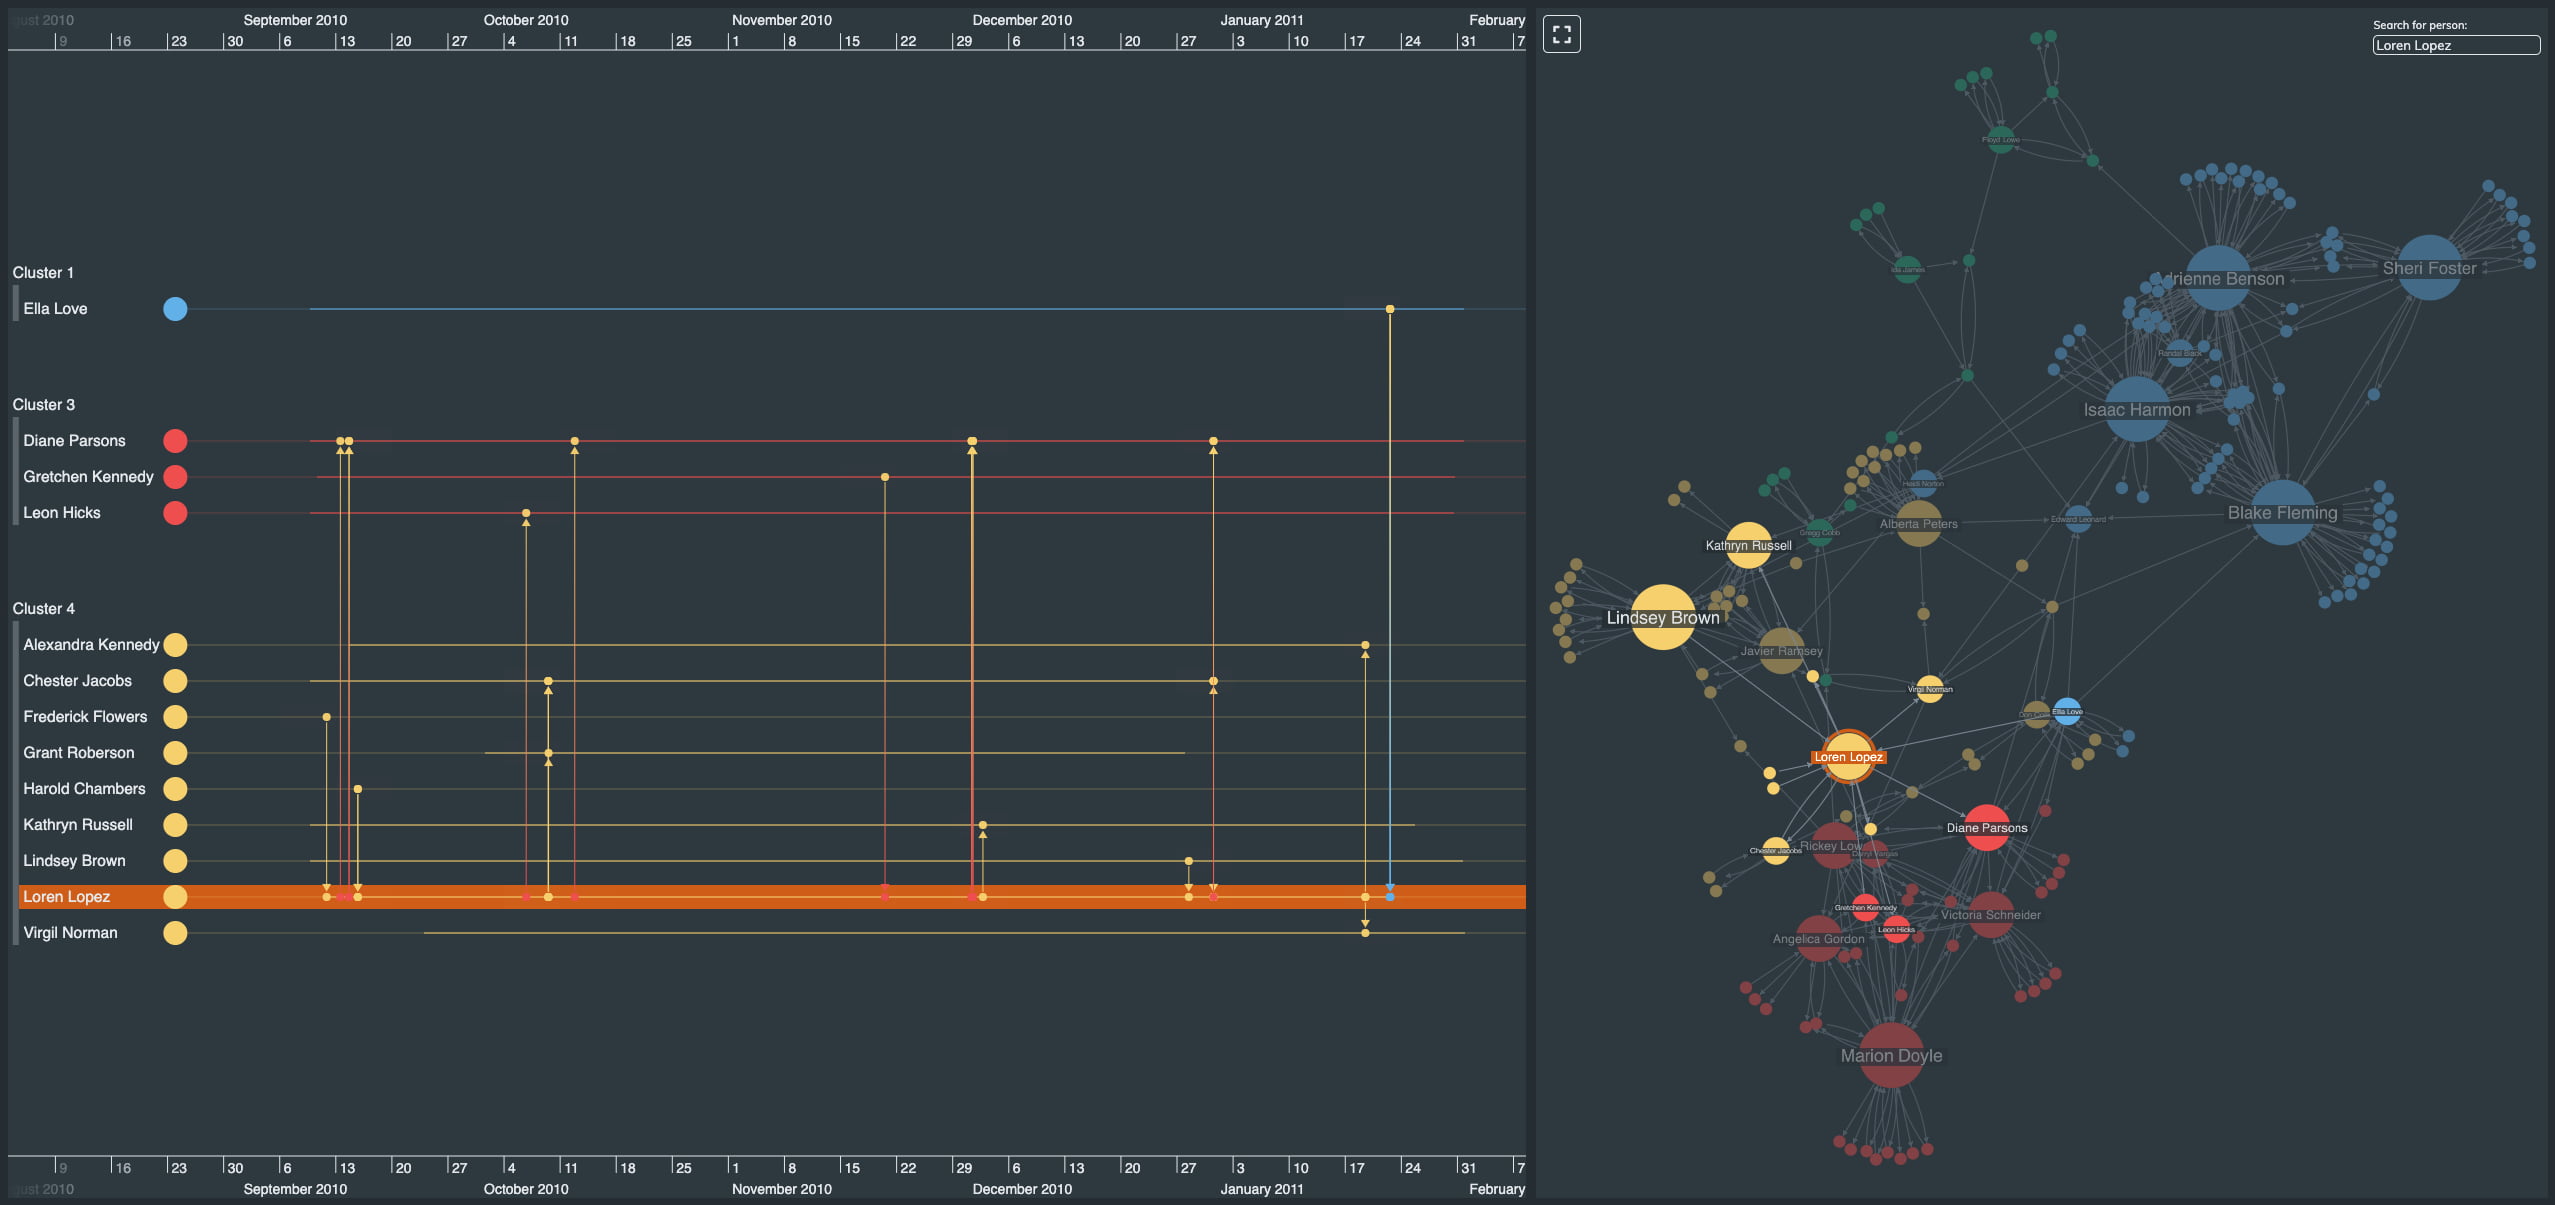
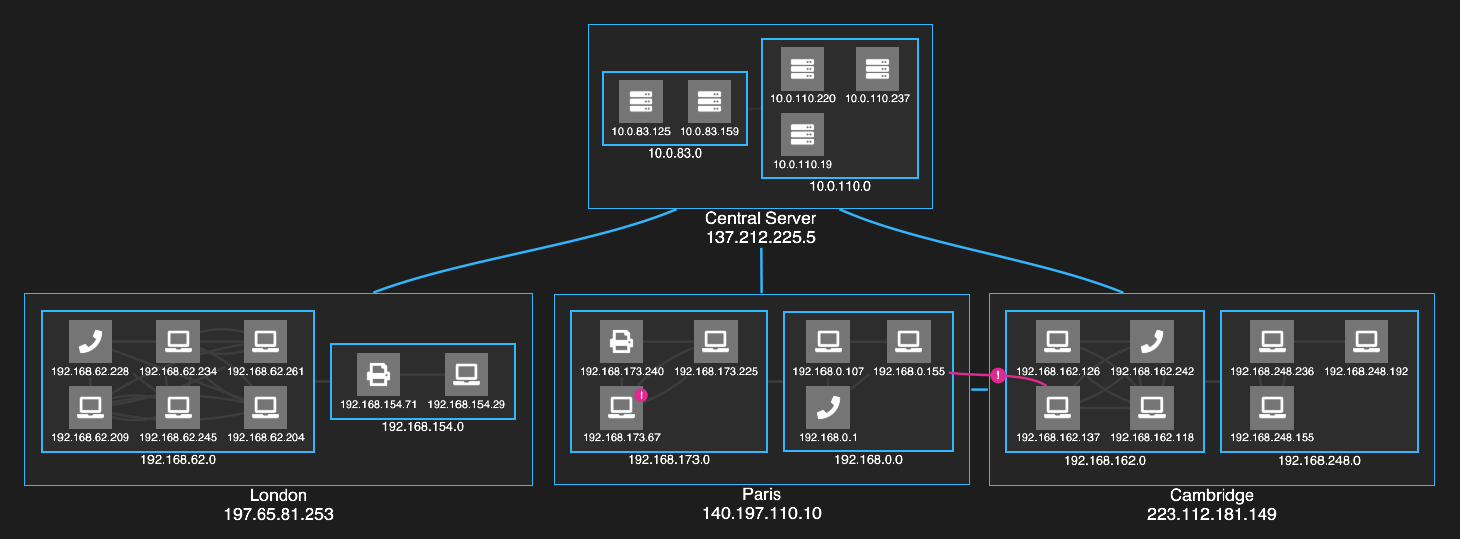
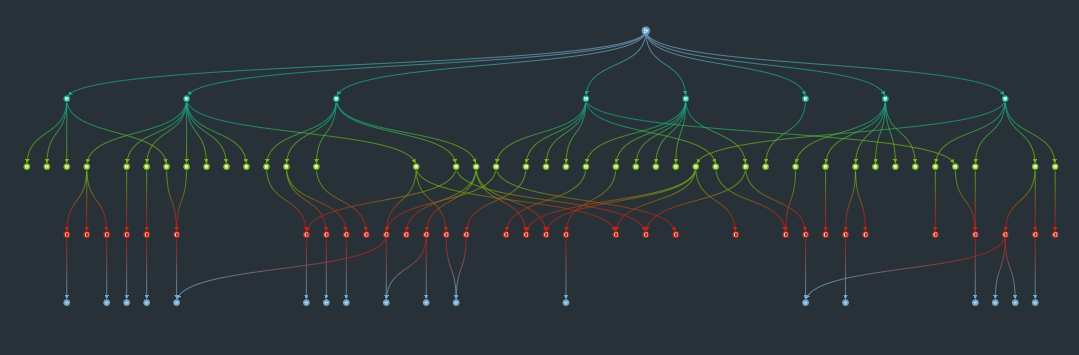
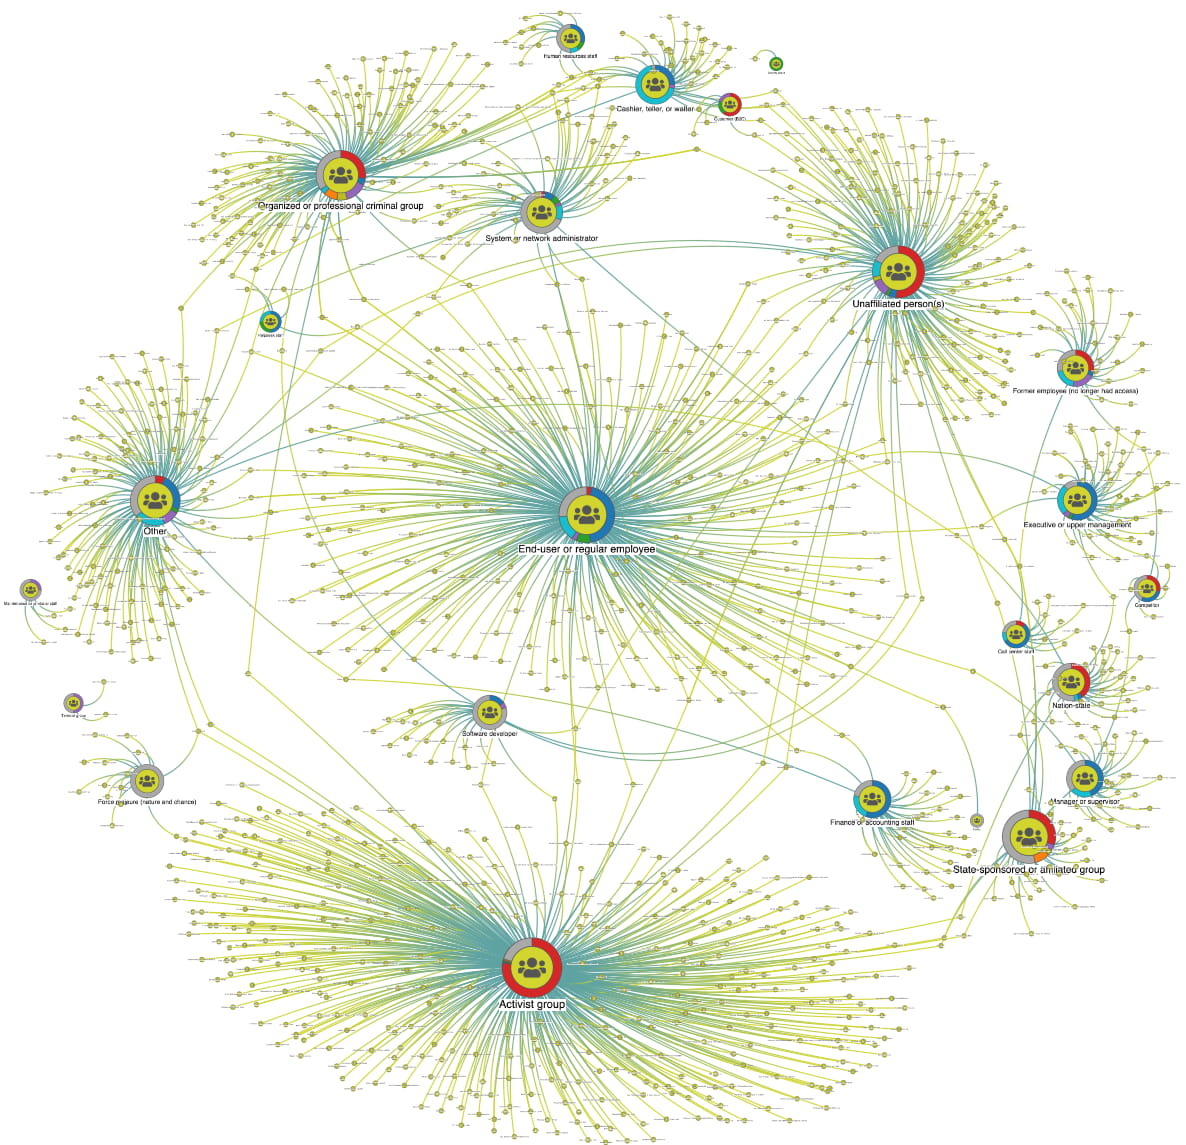
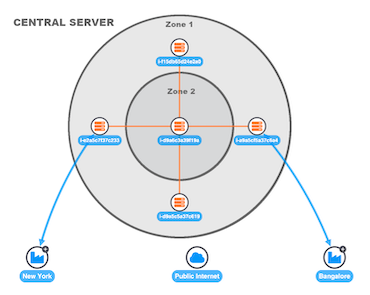
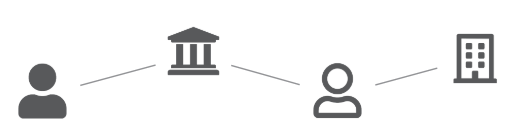
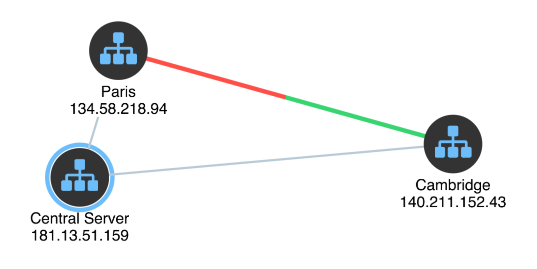
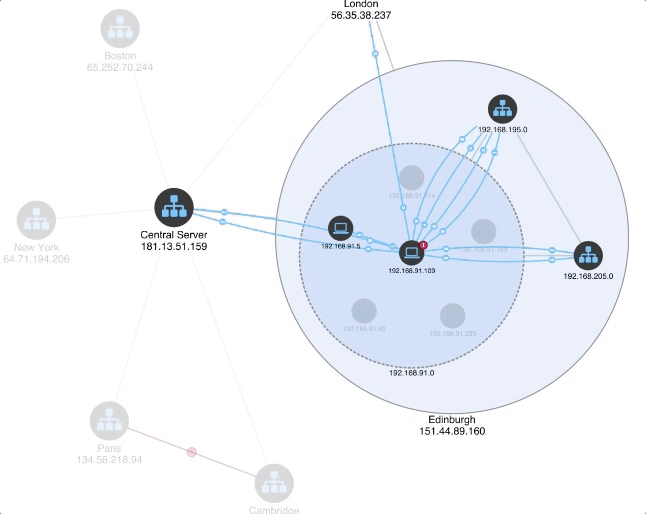
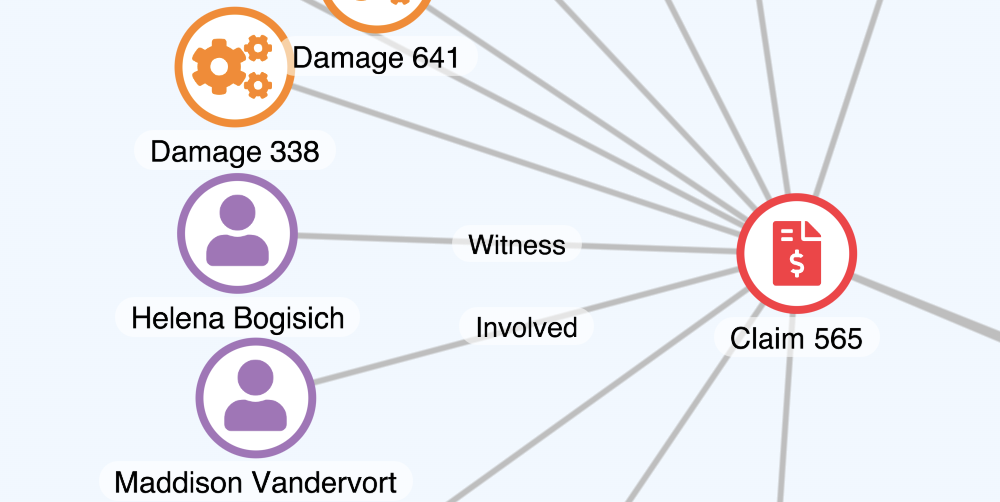
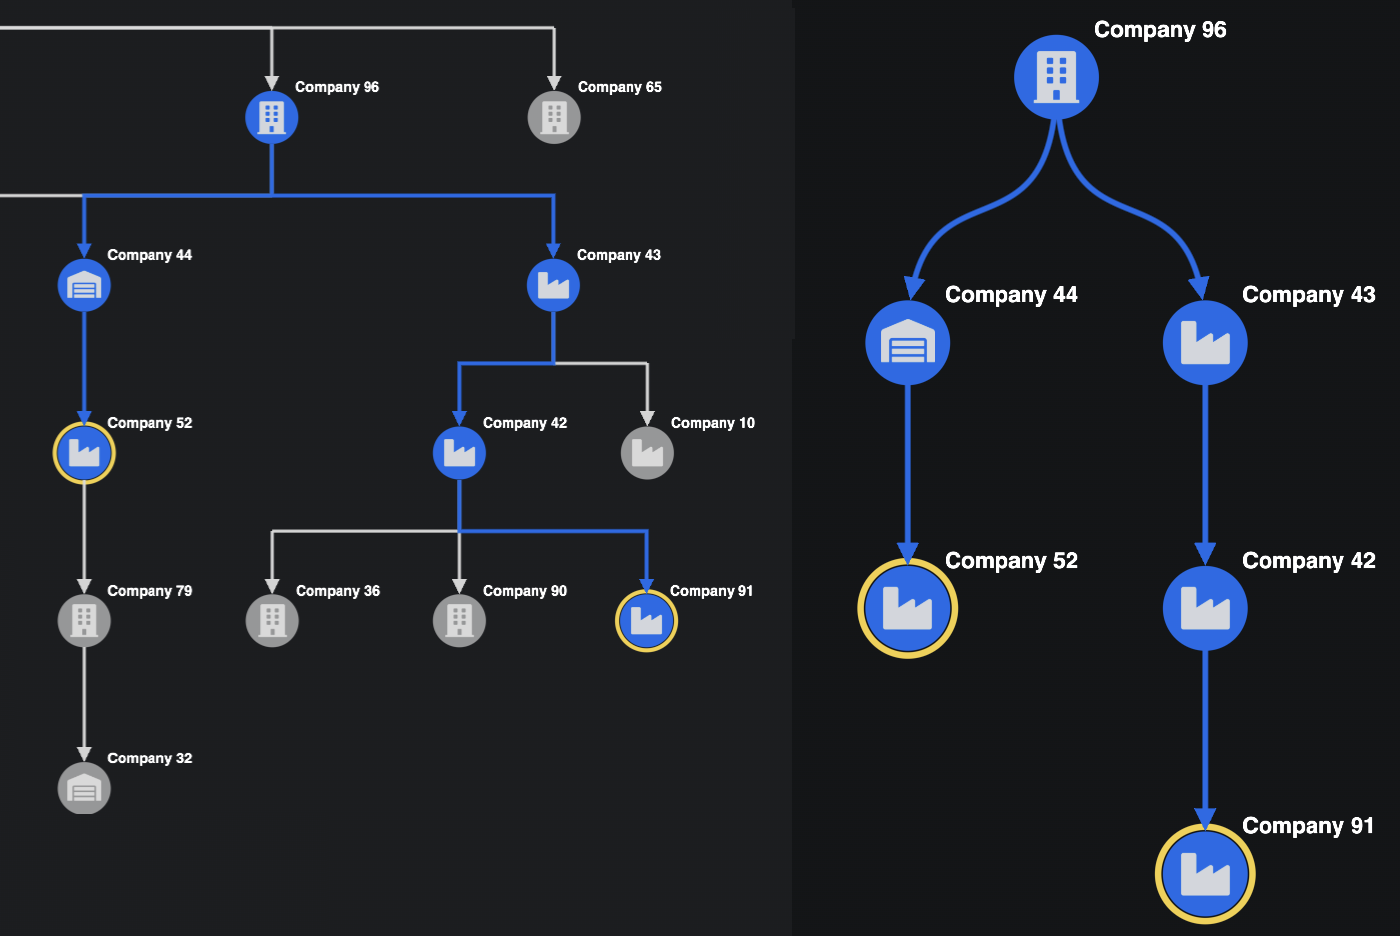
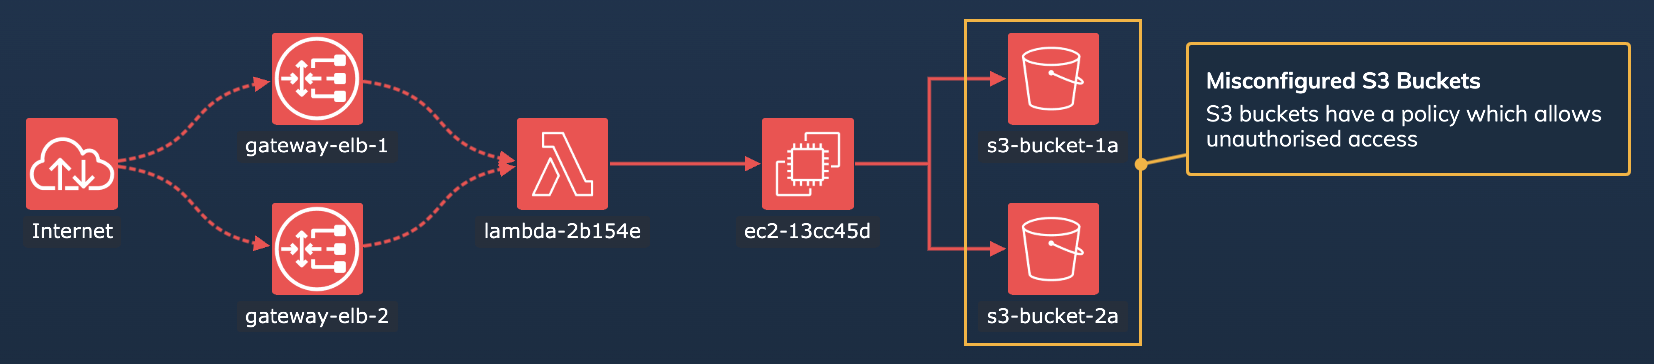
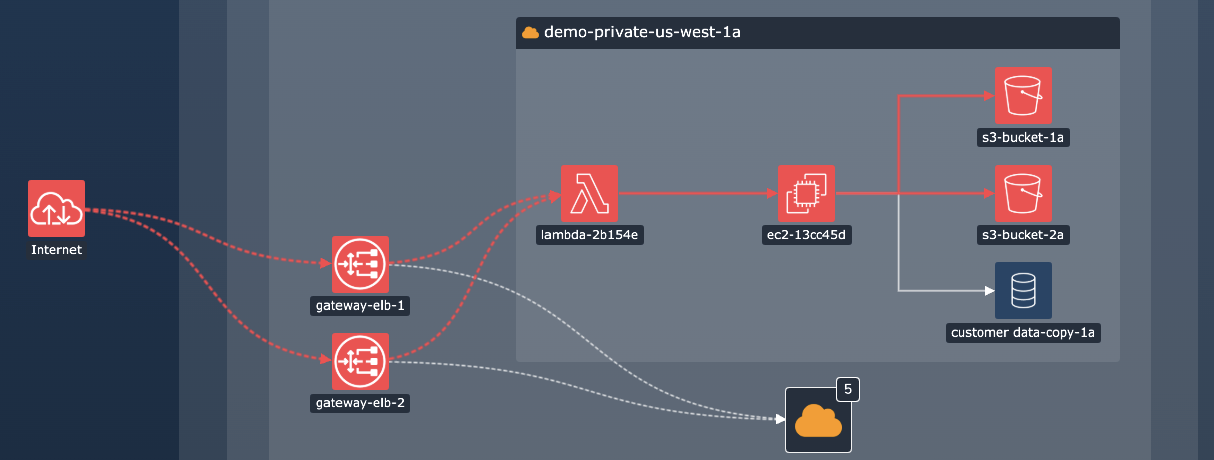
The highlight of this release is our new sequential layout. It's designed to display data that contains a clear sequence of distinct levels of nodes. It's ideally suited to represent tiered datasets such as IT infrastructure, or flow sequences such as blockchains.
For more details, see the Sequential Layouts demo and chart.layout() API documentation.
Enhancements
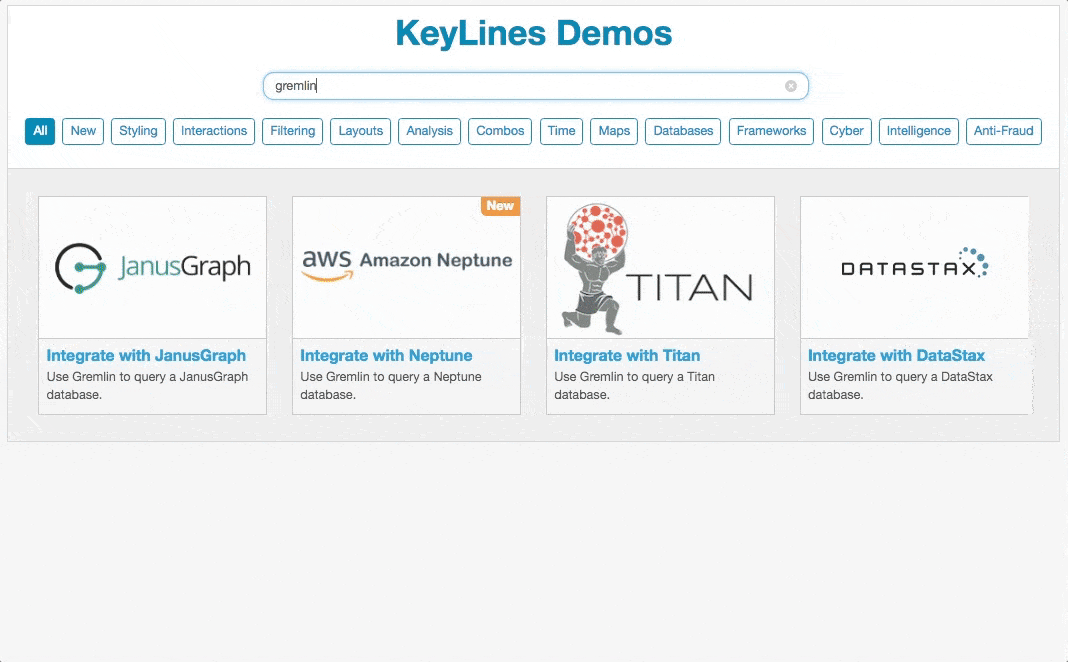
- New demo Integrate with JanusGraph shows how to use KeyLines with this scalable graph database forked from TitanDB.
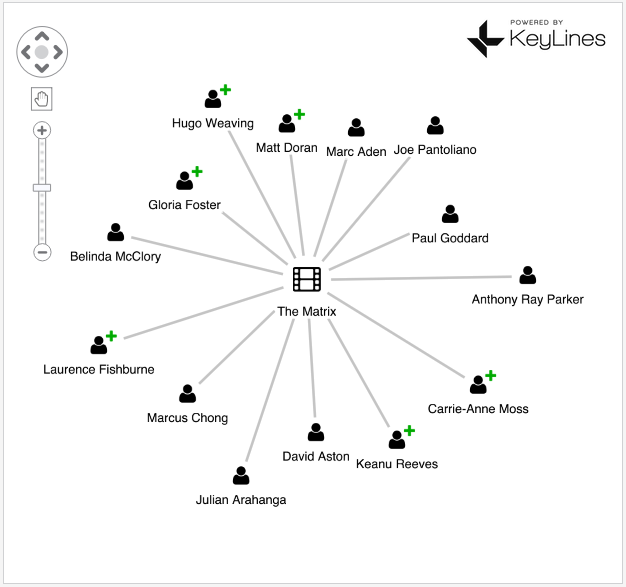
- Improved styling in Databases demos to give the movie data a more modern look and feel.
- Documentation improvements: it's now much easier to find details of Breaking Changes and Deprecations. We've also published the KeyLines Deprecation Process.
Bug fixes
- Fixed issue with mounting/remounting the Vue component.
- Links are no longer drawn to the tip of the arrowhead so they are not visible behind transparent arrowheads.
- chart.labelPosition now returns correct font size.
3.7 Release Notes23 October 2017
ENHANCEMENTSBUG FIXESDEMO CHANGES
Enhancements
Bug fixes
- Can now pass a DOM element when using AngularJS
- chart.expand() now handles hidden nodes correctly
3.6 Release Notes12 September 2017
ENHANCEMENTSBUG FIXESDEMO CHANGES
Enhancements
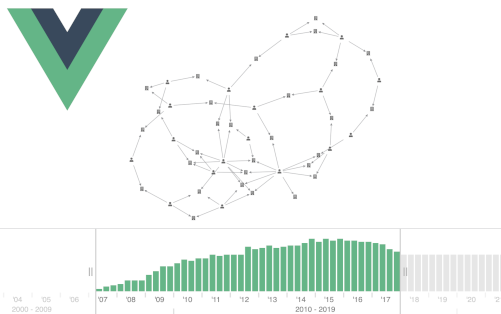
- New Vue component and integration demos
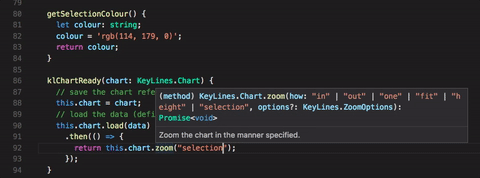
- Added ability to pass an array of ids into chart.zoom options
- Added time bar maxRange option so you can set a zoom out limit
- Included webpack.config and package.json files in framework demos (not for AngularJS)
- New demos: Style Links and Style Nodes
Bug fixes
- Multi-selected links now drag correctly
- Fixed stack overflow error when running layouts on 1000s of single node components
- Fixed chart.animateProperties issues affecting how nodes are drawn and properties set
- Made animation smoother for nodes with borders in WebGL
- Expanded links are no longer hidden when you switch from map mode to network mode
- Fixed issue where a nested combo's hide or foreground status didn't match that of its parent
3.5.5 Release Notes1 August 2017
ENHANCEMENTSBUG FIXES
Enhancements
- Added two new link arrowhead size options: 'large' and 'xlarge'
- Added the ability to pass a DOM element instead of an id to KeyLines.create
Bug fixes
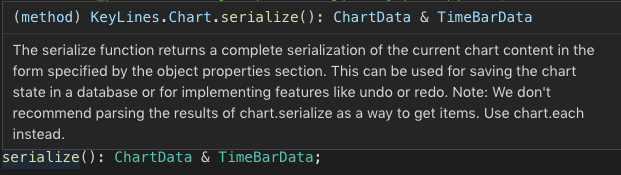
- Updated KeyLines TypeScript definition file so you can pass chart.serialize to timebar.load()
- WebGL now handles overlapping nodes correctly
- Fixed issue with creating a link from a combo
- Fixed issue so radial layout 'top' option supports node ids with multiple characters
3.5 Release Notes4 July 2017
ENHANCEMENTSBUG FIXESDEMO CHANGES
The fastest KeyLines yet
Now rendering twice as fast as the previous release, KeyLines 3.5 is all about performance.
We've made improvements across the board to give your end users a lightning-fast user experience, even with large numbers of nodes.
We've also revised our API Reference page so developers can find what they need more quickly and easily.
There are new demos and sample code to help you make fast progress. We show you how to combine nodes on maps to reduce clutter, and integrate with ArangoDB.
Performance improvements
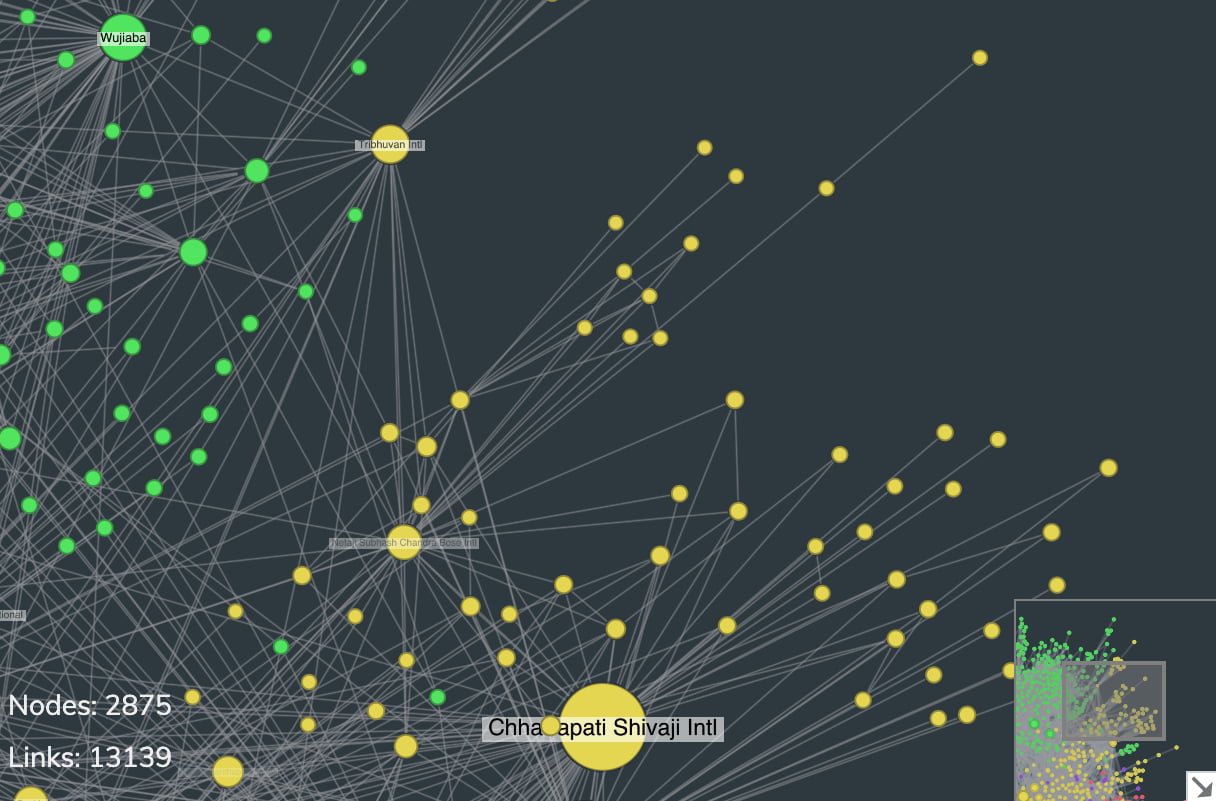
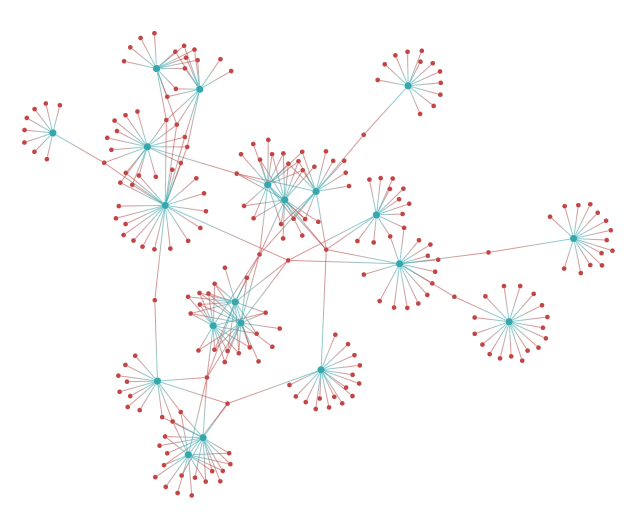
Benchmarking KeyLines performance is important to us, and we take care to make sure our charts deliver a great user experience.
One important benchmark is how many frames per second KeyLines can deliver when animating large numbers of nodes and links.
These large-scale animations stress the system, and a good frame rate tells us that end users will get a smooth, enjoyable chart experience.
In our test environment, KeyLines 3.5 delivers more than twice the frame rate of previous versions when animating a densely-connected network of thousands of nodes.
This means you can work with bigger and more complex datasets without worrying about the impact on performance.
Other improvements to performance in this release:
- WebGL is now the default rendering mode, so users will see KeyLines at its best. If WebGL is not available in the user's browser, KeyLines will fall back to Canvas mode.
- We've improved performance of combos, particularly when identifying parent combos of an item.
See improved rendering performance in the Test Performance demo.
Redesigned API Reference documentation
We've redesigned the API Reference to make it easier to use. You can now:
- Filter items in the navigation pane to find what you're looking for more quickly.
- See chart, map and time bar options in separate sections without having to hunt through functions to find them.
- Use our new, clearer layout to pick out key information for items more easily.
- Follow links to demos that showcase how to use specific functions and events.
If you have any feedback on these changes, or suggestions for improvements, we're keen to hear from you. Send feedback
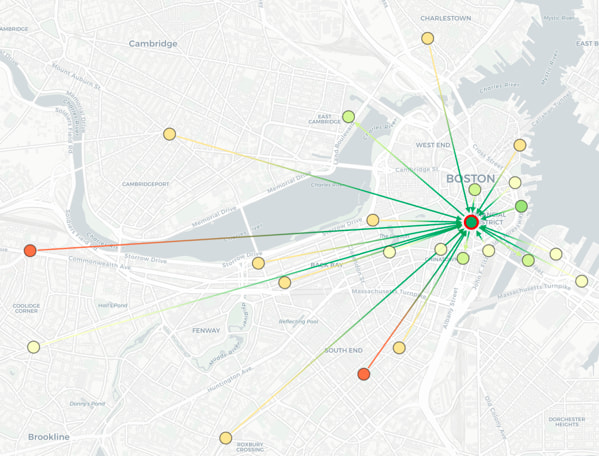
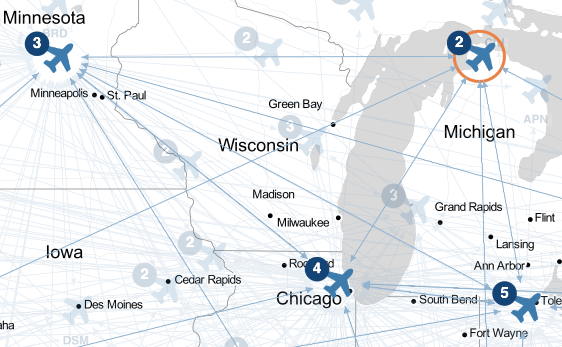
New demo: Combos on Maps
Users often want to remove clutter from maps, particularly when zoomed out.
The KeyLines Combo feature is great for this.
In the new Combos on Maps
demo, we show you how to use combos to group items that are in close proximity, and dynamically change the groupings as the user zooms in or out.
New demo: Integrating with ArangoDB
We’ve added an Integrate with ArangoDB demo that shows how to get ArangoDB databases working with KeyLines.
ArangoDB's Foxx microservice framework lets you create V8 JavaScript microservices that run directly within the database, so you can serve up data in exactly the form KeyLines needs.
Features move out of Beta
We're happy to announce that a number of features are out of Beta development. These are now established features of the KeyLines toolkit:
The extend option for the time bar play function is out of Alpha and is now an established feature too.
Advanced notice: end of support for IE9 and 10
This KeyLines release will be the last to support Internet Explorer 9 and 10.We're following Microsoft's direction after they stopped support for these older versions back in January 2016.
Breaking API changes
See 3.5 Breaking Changes
Bug fixes and enhancements
- TypeScript timebar.range() return is now correctly defined.
- Fixed an issue that could cause an exception when creating large numbers of combos.
- Fixed WebGL varyings issue.
- TypeScript now builds without errors in Angular demos.
- toDataURL images now include background colour.
- Fixed an issue where the hierarchy 'level' option could generate an exception with large datasets.
3.4 Release Notes29 March 2017
NEW FEATURESENHANCEMENTSBUG FIXESDEMO CHANGES
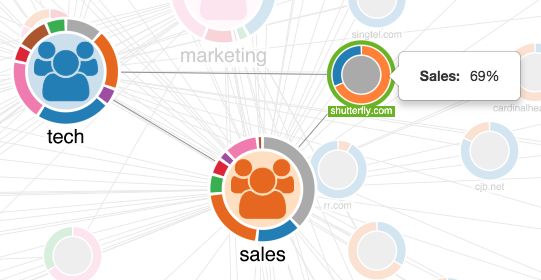
Introducing donuts
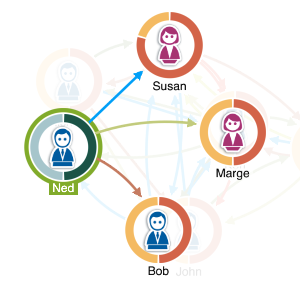
Graphs are great for getting a sense of network structure at a glance, but sometimes you need to convey data values quickly too. To help, we've created a new donuts feature. Donuts display relative data values as node borders, so charts are enriched with information without becoming too complicated. More details
The rest of this release is about improving the developer experience. If you're new to the SDK, our updated Quick Start guide means you can get KeyLines working and start visualizing data in minutes.
New support for TypeScript also lets you take advantage of the time-saving features it offers while you're writing code for KeyLines.
Together with support for Angular and new demos, we hope you'll think that our development effort has been time well spent.
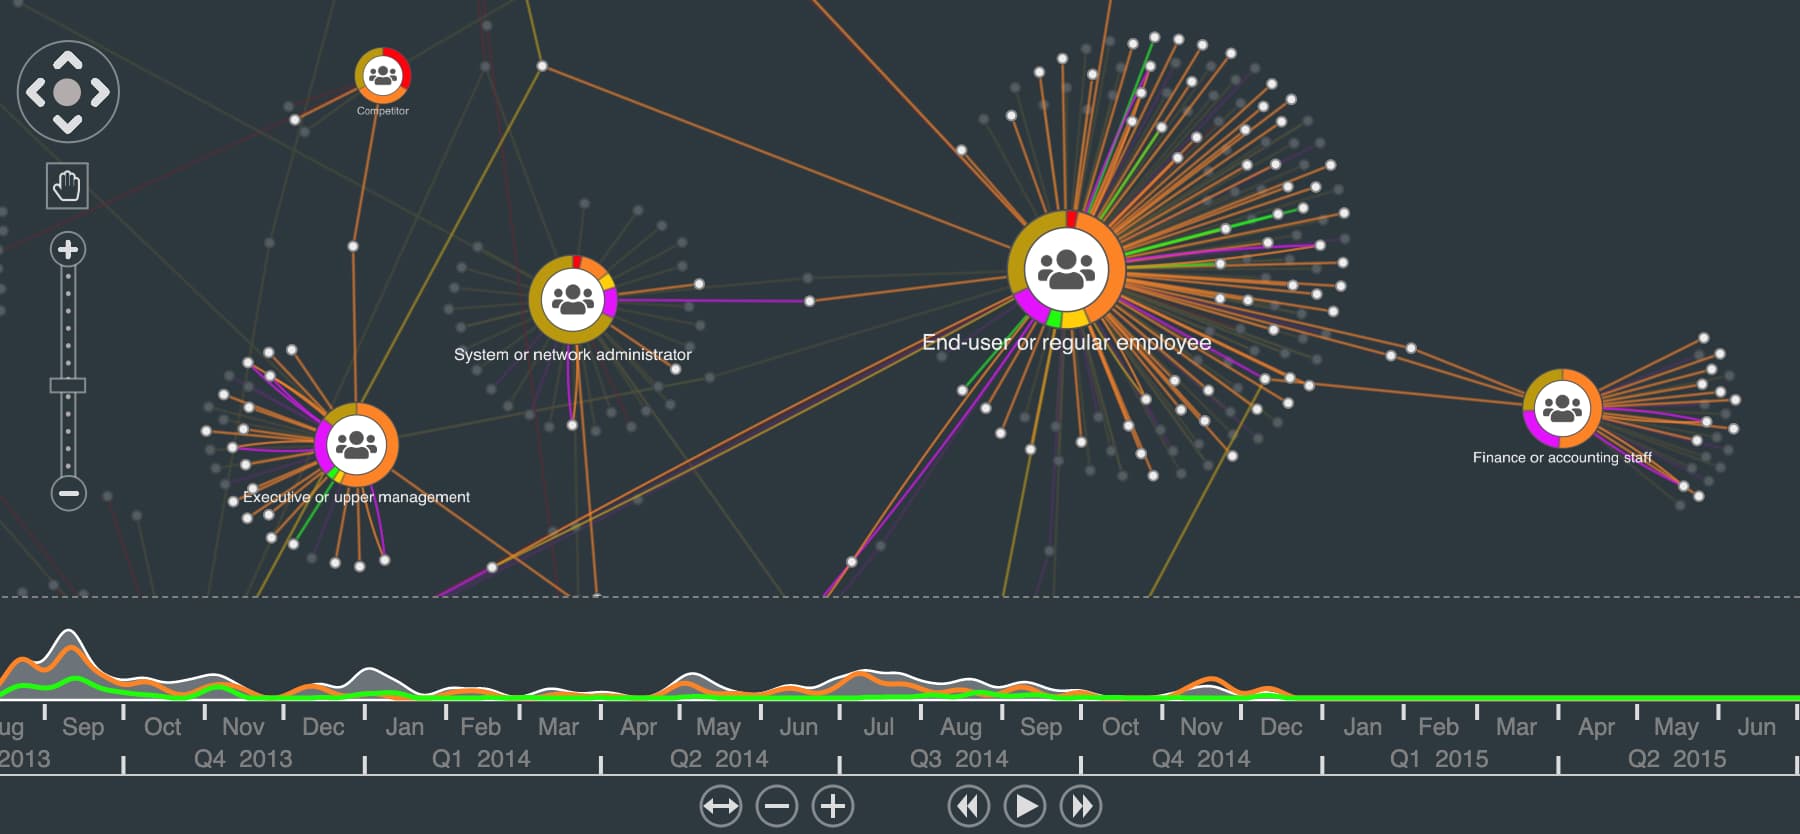
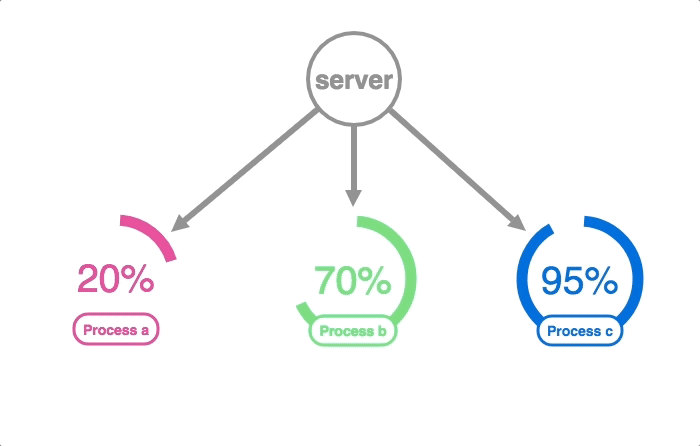
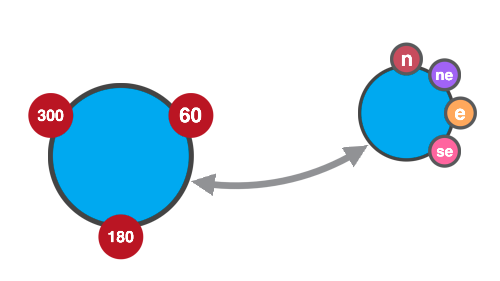
New: Donuts (Beta)
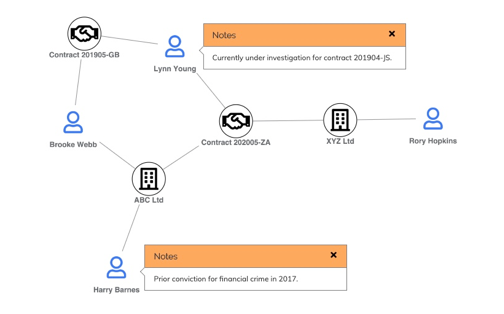
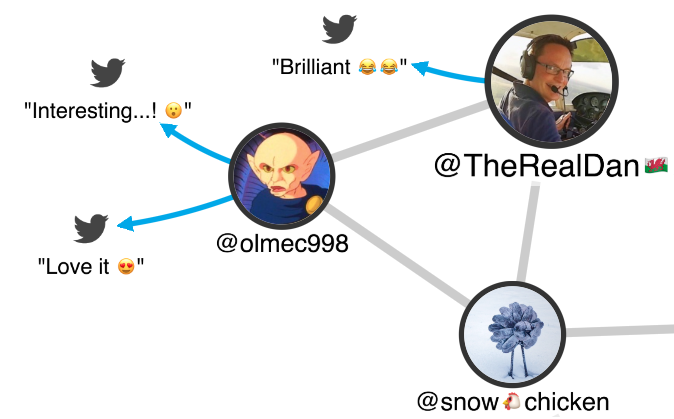
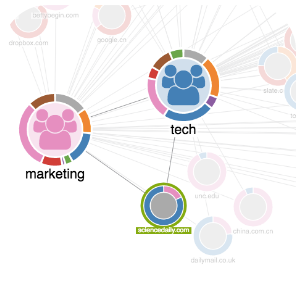
Sometimes you want to show node values as numeric proportions. For example, you might want to know the relative proportions of certain kinds of network traffic handled by a router. Or, if you're investigating fraudulent reviews of shopping experiences, you want to show the ratio of positive reviews a person writes compared with negative ones.
It’s hard to represent these clearly with labels or glyphs, so we’ve developed donuts.
Donuts are circular node borders divided into segments that add up to 360 degrees.
They work just like pie charts.
Donuts are entirely customisable - you can select how many segments you want, choose colour palettes, set segment and border widths, add tooltips and more.
We’ve created demos to help you get started with donuts. See:
New: Support for TypeScript (Alpha)
We know many of you use TypeScript code, so we've added support for this.
It means you can take advantage of key features including strong typing, context docs and IntelliSense.
TypeScript supports type annotations that let you record contracts of functions and variables in a lightweight way.
You can use existing JavaScript code, other JavaScript libraries, and call TypeScript code from JavaScript.
KeyLines comes with detailed type definitions that you can include in your TypeScript project which makes coding in TypeScript much easier.
For more information, see TypeScript (Alpha).
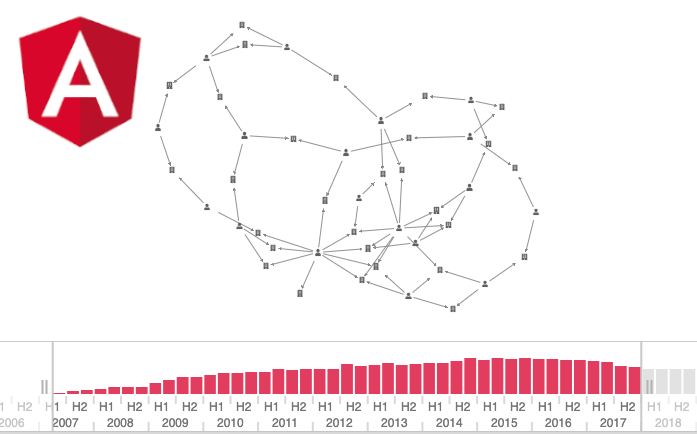
New: Support for Angular
We're pleased to announce support for the latest Angular platform with our Angular component.
Angular is the official name of the latest web application platform from the team that built AngularJS 1.x.
The two platforms are not the same - Angular is a complete rewrite of AngularJS.
We've also created a new demo to help get you up to speed with Angular. See:
We still support AngularJS 1.x with our AngularJS directive, in fact we've improved the current documentation and demos. See:
- AngularJS 1.x
- AngularJS Integration
- ngularJS Integration: Time
Updated Quick Start guide and other doc improvements
We want to make the KeyLines evaluation experience as simple as possible.
This includes making sure new users can get up and running quickly and easily, which is why we've rewritten our Quick Start guide.
We've made other documentation improvements by adding guidelines on:
Demo changes
New
Updated
- Test Performance - there's now an option to show/hide labels
- AngularJS Integration - improved demo description
- AngularJS Integration: Time - improved demo description
- React Integration - improved demo description
- React Integration: Time - improved demo description
- Integrate with Neo4j - updated to use Neo4j 3.1.1
- Neo4j Integration: Time - updated to use Neo4j 3.1.1
- Layouts - runs fit and tightness separately to show the effects more clearly
API changes
Bug fixes and enhancements
- Fixed WebGL flattened font icon issue
- RTL text in WebGL supports newline characters
- Characters displayed correctly when nodes are moved using the keyboard in WebGL
- Added blacklist support of Google SwiftShader rendering to WebGL
- Map-Based Networks demo no longer crashes in Firefox
- Maps dragged out of bounds bounce back correctly
- Map touch functions work on Windows touch devices in Chrome
- Fixed unexpected grey background during transition to map mode
- Touch functions on Windows touch devices in Chrome no longer throw MSGesture errors
- KeyLines now supplies subwidget ids for glyphs displayed in a row
- Double-clicking on right mouse button no longer zooms in on Firefox
- Layouts no longer straighten self links
- Standard layout now fixes two-node components properly
3.3 Release Notes15 December 2016
NEW FEATURESENHANCEMENTSBUG FIXESDEMO CHANGES
Self-Linking Nodes
We’ve responded to user requests and developed a new Beta feature: self-linking nodes. More details
We’re also happy to announce that our high-performing WebGL rendering engine is out of Beta and is now an established feature of KeyLines. More details
You'll notice that we've revamped the Demo page to make navigation easier.
Amongst the new demos we've added, there's one showing you how to use a REST API to integrate with Elasticsearch.
We've made improvements to existing established features too, including clusters, font icons and the time bar. More details
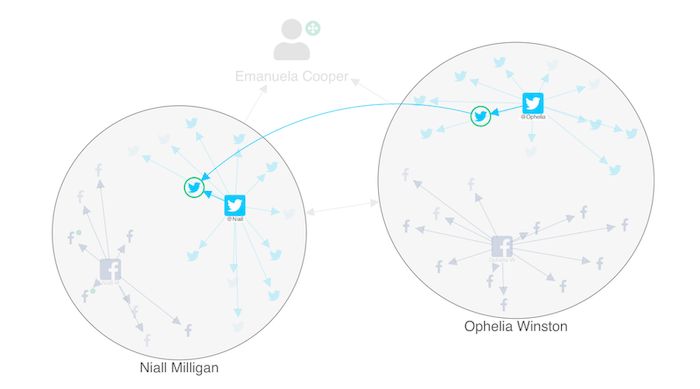
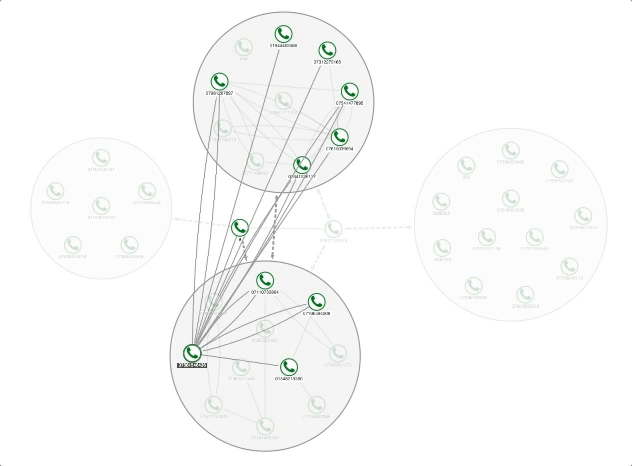
New: Self-linking nodes (Beta)
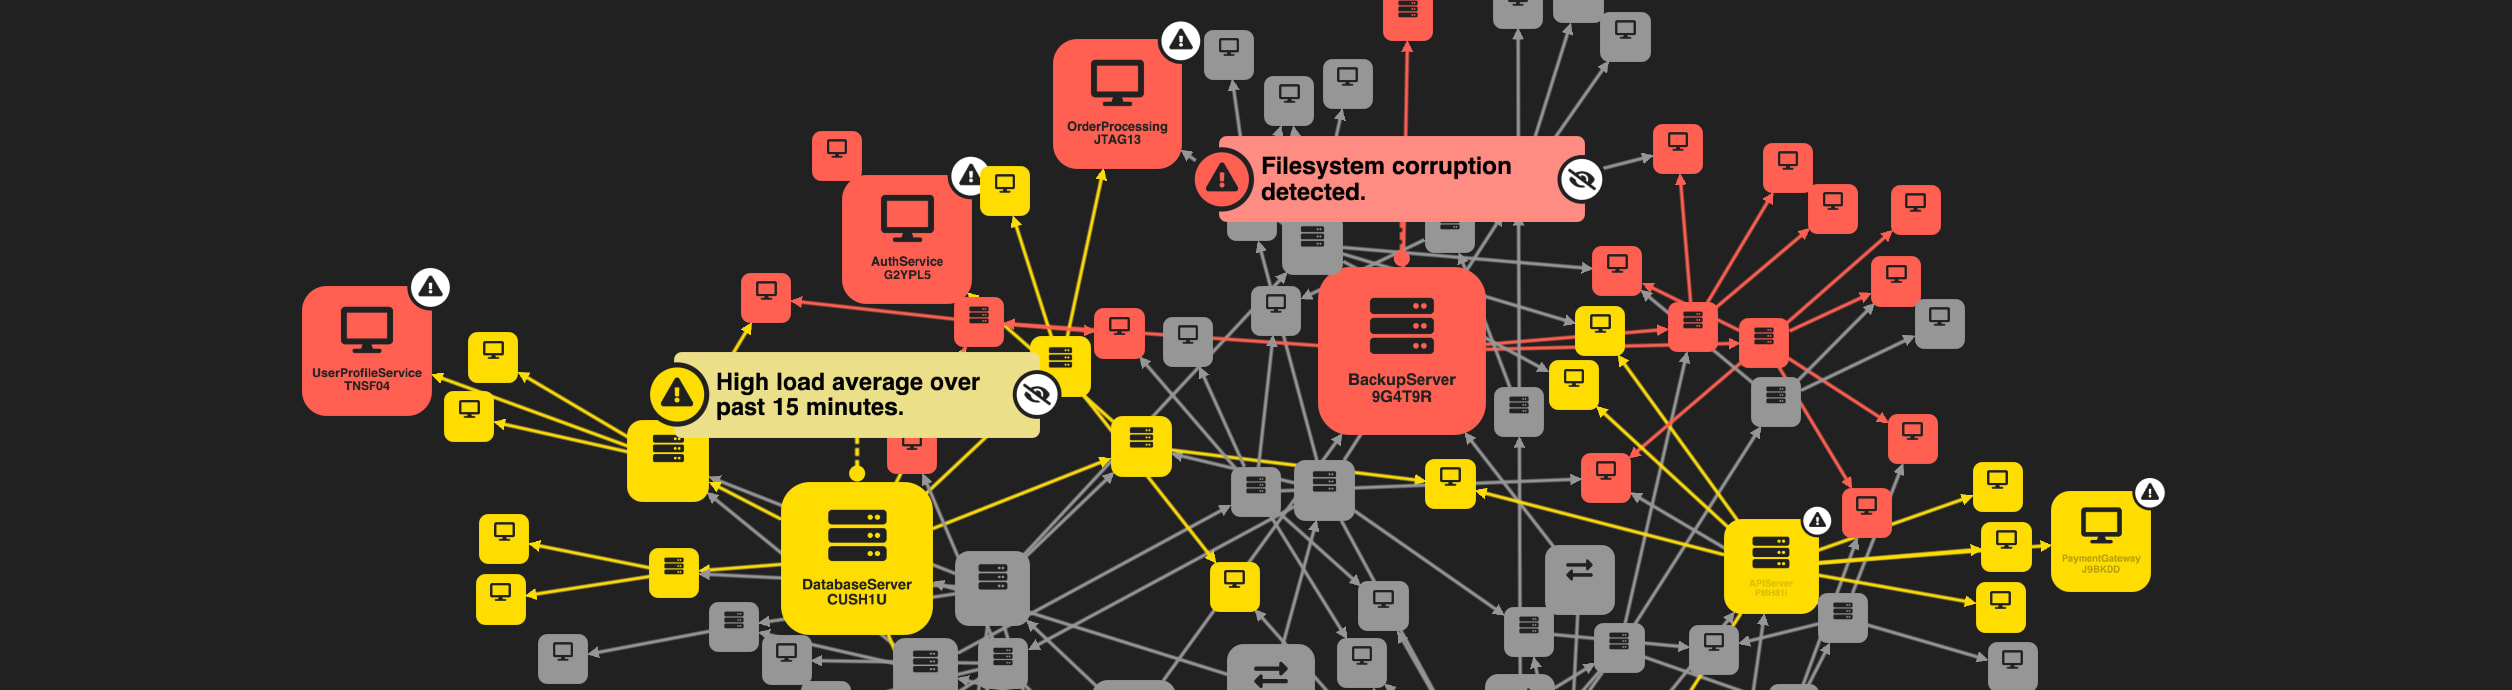
If you're analysing an IT network or cyber threat, it's not unusual to find nodes that send network traffic to themselves. For example, an email may be copied to a sender's address.
But how do you represent this behaviour on a chart? The answer is by using self-linking nodes.
These are nodes with outgoing single or multiple links that loop back to themselves.
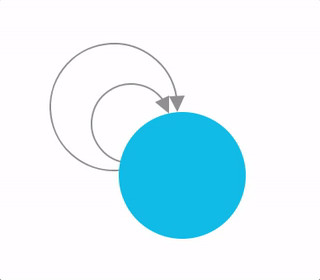
There’s also a demo to showcase self-linking nodes. See the Nodes with Self Links demo.
WebGL improvements (out of Beta)
WebGL is no longer in Beta and is now an established feature of KeyLines. Since the last release we’ve made the following key changes:
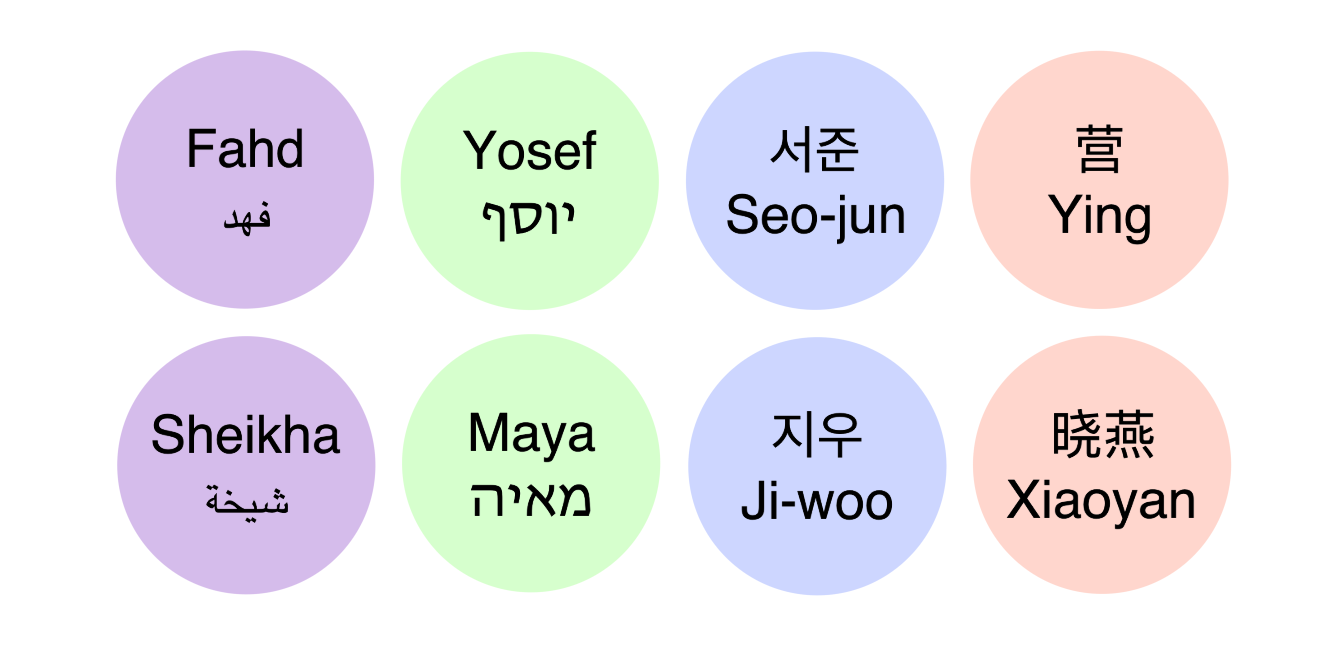
- Added support for right-to-left (RTL) writing systems such as Arabic and Hebrew. We’ve also added a demo to show how this works. See the Multiple Languages demo.
- Improved curved lines. Arcs in WebGL are made up of a fixed number of segments. Previously, these could look jagged when you zoomed in, but they’re now much smoother.
- General improvements to stability and performance.
New: Elasticsearch Demo
We’ve added a new Integrate with Elasticsearch
demo that shows how to get Elasticsearch data working with KeyLines.
You can use REST queries to retrieve data and let users explore complex networks in large databases.
The demo also shows how to map visual information to the items in the graph database.
To get started, view the source code and then download it.
For more information, see our web article Visualizing the Elasticsearch Graph API with KeyLines
Font Icon position improvements (out of Beta)
We’ve improved the way selected font icons are displayed.
When you select a regular icon, KeyLines adjusts the width and height so it fits inside the selection boundary.
The same now applies to font icons, so font characters can no longer overlap the boundary.
If icons still aren’t positioned exactly as you’d like, use the new imageAlignment chart option to make further tweaks.
Lens Layout includes the tightness option (out of Beta)
By default, the tightness option now applies to the Lens Layout.
Previously, applying the layout would give you a fish eye view of the chart, and some nodes would be spread far apart across the chart.
The Chart layout tightness option automatically positions the nodes closer together.
To try out Lens Layout tightness for yourself, see the Layouts demo.
React component rewritten
Many React users prefer ES6/JSX, so we’ve rewritten the React component to support ES6 classes.
We’ve also updated the React component to support the time bar.
There's a new React demo to show how you can filter chart items by time. See React Integration: Time
The react-keylines.js file in the demo source code also contains an example of how to use ES6 class syntax.
New: Support for Promises ES6 (Beta)
To comply with the ES6 version of JavaScript, we’ve added a KeyLines.promisify() function that lets you use promises instead of callbacks.
A promise represents the result of an async function before that result is known.
There’s also a demo that shows how you can organise your code to support promises. See Promises.
Cluster discovery is now deterministic
You can now choose whether you want your results to be the same or different every time you run a cluster.
To do this, in the Graph clusters function, use the consistent option.
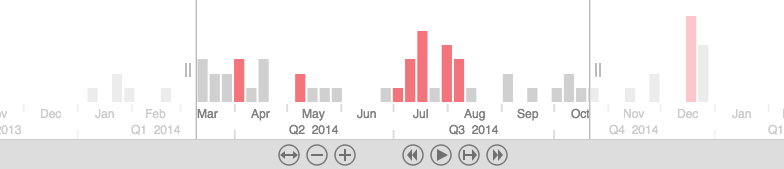
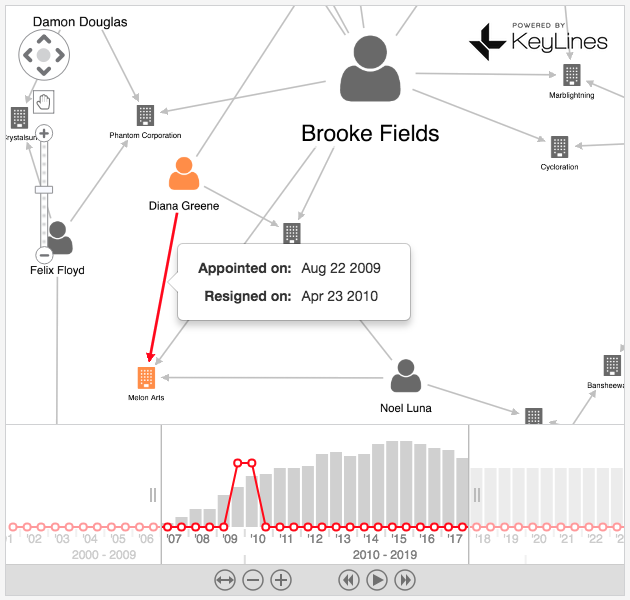
Time bar improvements
Choose a time bar font
You can now use a fontFamily option to specify which font to use in the time bar, just as you can already for main chart objects.
Set the time bar font size
If you change the height of your time bar, it makes sense to change the relative size of the time bar font too. We’ve added a fontSize option that lets you do this.
Support for multiple font icon families
You can now use the 'ff' option on nodes to include icons from different font families on the same chart.
The 'iconFontFamily' chart option sets the global family. The 'ff' node option lets you overwrite this and use a different font family for a specific icon.
It works the same way as the existing 'ff' font option.
It can take a long time to load Font Icons from multiple Font Families.
To improve performance, we recommend that you create a single, custom Font Family containing the icons you want to use.
See What's the best way to load Multiple Font Icons?
Control alignment of font icons and images
Font icons and images are not always positioned accurately inside nodes and glyphs.
You can now adjust their position and scale using the new chart ‘imageAlignment’ option.
We’ve also added a demo to showcase how it works. See Align Images.
Demo page improvements
We've added filters, so it's easier to find the demos you’re interested in.
- If you're evaluating KeyLines, start with the featured demos, case studies and fundamentals.
- If you're an existing user, see What's New?, or find demos that show the features or types of analysis you’re interested in.
We've also made the demo names and descriptions clearer, so you can identify at first glance which demos showcase the features you want to include in your application.
Demo changes
New
Updated
- Animate Items - now demonstrates how font icons can be animated too
- Integrate with Titan - supports Titan 1.x and TinkerPop 3.x
- React Integration - supports ES6
- Font Icons - supports the imageAlignment function
- Clusters - supports the tightness function
- Customise the Time Bar - lets you change the time bar font family and size
Breaking API changes
See 3.3 Breaking Changes
API changes
Bug fixes and enhancements
- WebGL text rendering bug fixed by the Firefox team in Firefox 49.0.2.
- Links rendered correctly using WebGL in Chrome with Radeon 370m Graphics Card.
- Fixed misleading time bar decade labelling.
- The WebGL switch works correctly in demos.
- Combos no longer inherit their visible status from the first node.
- Fixed issue where histogram bars extended past the time bar range.
- CreateLink callback now returns null if the link isn't created
- Nodes in the Neo4j demo no longer move to the other side of the chart.
- KeyLines downloads won’t serve expired keylines.js.
- Layouts in the Titan demo work correctly.
- Right hand demo panel is no longer broken in Chrome 55.
3.2 Release Notes15 September 2016
NEW FEATURESDEPRECATIONSENHANCEMENTSBUG FIXESDEMO CHANGES
Better ways to work with large datasets
In this release, we’ve made working with larger datasets quicker and easier. You’ll see improvements to the way filtering, expanding and layouts work, and for the first time be able to run graph calculations without visualisations. We’ve also added a demo on how to integrate with vast datasets in DataStax Enterprise Graph, and upgraded WebGL from Alpha to Beta status.
Highlights include:
- Better filtering
- Greater flexibility and control over layouts
- Flexible graph functions without graph rendering
- New time bar option to limit zoom level
- Beta version of WebGL
- New DataStax Integration Demo
- Withdrawal of support for Flash
- Demo changes
- API changes
- Bug fixes and enhancements
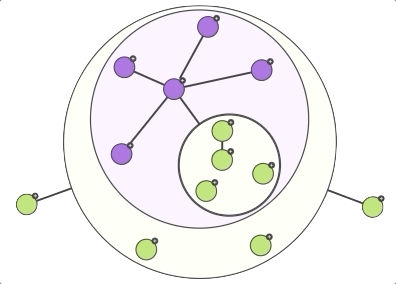
Better filtering
We’ve made it much easier to use combos with filters. You can use the new filter option to apply filters to items inside combos. If every item in a combo is filtered out, that combo won’t be displayed. This means you’re only ever looking at the items and combos you’re interested in. It saves you having to write custom combo filter code to handle this.
To improve filtering further, we’ve added a filter condition to the expand function. When you expand an item, your existing filters are applied to the new nodes and links added to the chart.
Greater flexibility and control over layouts
If you’re analysing a chart with lots of items, you don’t want node positions to shift unexpectedly when you change layout or add items. We’ve added an option to retain the position of existing nodes whenever you:
- re-apply a standard, structural
or lens layout
- expand an item to add new data to the chart
We’ve improved the default hierarchy layout. Higher-level node structures are now stretched, fully exposed and much easier to read. This is useful when you’re analysing large, flat hierarchical data that can produce long, narrow charts with links and structures that are difficult to see. To revert from the default layout to the previous style, use the flatten option.
Previously, the expand function displayed new items on the chart using the standard layout. This wasn’t ideal if the rest of your chart used a different layout.
We’ve updated this function so you can choose a layout style to match the rest of your chart: standard, hierarchy, radial or tweak.
Want to see how it works? Try the new Incremental Layout Demo
Flexible graph functions without graph rendering (Beta)
In previous releases, KeyLines had to render a graph before you could start analysing the data. This was okay for small datasets, but not for larger ones that took much longer to render.
We’ve fixed this in 3.2 by creating a separate Graph Engine to perform analysis. You can now run graph calculations on larger datasets without having to wait for charts to display fully. You can also:
- run the Graph Engine on a different server using Node.js
- filter the dataset to display only the items you need to analyse
For more information, see the Graph Engine Documentation
The Graph Engine is in Beta development. Your feedback will help shape the future of this feature, so we’d love to hear your thoughts. Email [email protected]
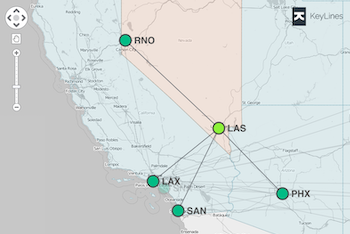
DataStax Integration Demo
We’ve added a new DataStax Integration Demo to show you how to get DataStax Enterprise (DSE) Graph databases working with KeyLines. You can use Gremlin queries to retrieve data, letting users explore highly complex relationships in vast datasets. The demo also shows how to map visual information to the items in the graph database. To get started, view the source code and then download it.
For more information, see our web article Visualising the DataStax Enterprise Graph
New time bar option to limit zoom level
The time bar lets users zoom into an ever decreasing date and time interval. However, if your time data is constrained to a particular minimum level such as a day, zooming beyond that level may not be useful. A new time bar option, minScale, lets users limit their zoom level.
Note: minScale replaces the minRange option, which has been deprecated. You can still use minRange, but we recommend using minScale instead.
WebGL moves to Beta
Thanks to your feedback we’ve continued to make significant improvements to WebGL. We’re happy to announce that it’s now moved to Beta. In this release we’ve focused on rendering quality to make sure there’s better consistency with the charts rendered in Canvas. Key improvements include:
- the appearance of dotted and dashed lines
- the clarity of text and images so they’re sharp at any zoom level
For more information, see the WebGL Documentation
Removed Flash support
Earlier this year we announced plans to end Flash support, and we’ve removed it from this release. If you need to continue supporting Flash, email [email protected]
Demo changes
API changes
- Expand has two additional options, layout and filter:
- layout specifies the layout of newly returned items
- filter applies filtering constraints to newly returned items
- Layout has new consistent and flatten options:
- consistent retains node positions between similar layouts
- flatten controls how hierarchy layouts are displayed
- The new minScale time bar option lets you limit the zoom level
- Filters have new combo and updateGlyph options:
- combos are used to filter the contents of the combo
- updateGlyph updates the text of the combo’s glyph to show the number of visible items inside the combo node
- You can use the Graph Engine and the visual KeyLines chart separately (getGraphEngine, graph.clear & graph.load)
Deprecations
- The minRange Time bar option has been deprecated. We recommend using minScale instead.
Bug fixes and enhancements
- Background correctly displays RTL text (Canvas)
- Better exception text when setting an invalid link
- Standard layout now restores large charts successfully after radial layout
- Able to navigate and pan the dependencies demo
- Sliders on the time bar are easier to use on touch devices
- Can drag the time bar by the major and minor scales
- Improved appearance of WebGL text, icons and nodes
- Better exception text for WebGL when the number of unique text characters are exceeded
- Combo link remains deleted
- Combo in map mode applies the 'e' style object properly
- Tweak layout now works correctly when nodes are stacked and have the 'e' size set
3.1 Release Notes28 June 2016
NEW FEATURESENHANCEMENTSBUG FIXESDEMO CHANGES
Greater Control and React
Introducing KeyLines 3.1 – built to give you greater control, more flexibility and a faster developer
experience.
Highlights include:
- An improved hierarchy layout
- New glyph resizing controls
- Auto-ellipsis of long labels
- High-definition assets for your charts
- Integration with React.
As always, we would love your input for our future releases. Make your voice heard! Send thoughts and
suggestions to [email protected].
Adding controls to the hierarchy layout
Many datasets include some kind of hierarchy or dependency. In this release, we have added the ability
to override the automatic layout so you can place a node in a specific vertical layer. This means you
can force nodes with shared attributes into layers, flowing from top to bottom to give a clearer presentation:
See our new Hierarchies demo for more details.
Display enhancements
Other enhancements in this release are designed to help you build clearer, easier to use applications:
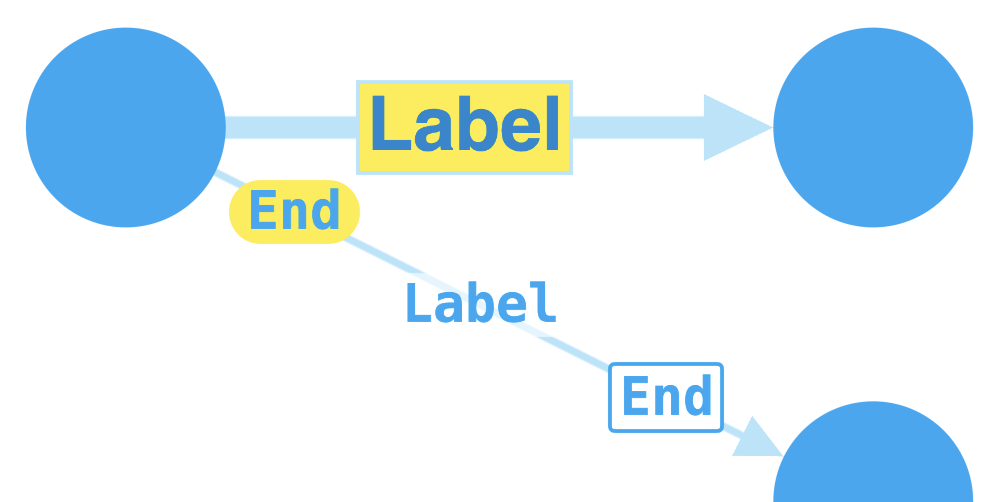
- Labels: A new ‘text centre’ option allows you to override the automatic positioning of labels below nodes.
- Glyphs: KeyLines’ glyph sizes are now configurable – so the most important ones can be appropriately sized.
- Auto-ellipsis: We’ve made it simpler for you to automatically truncate long labels in a clean and predictable way.
Important: Changes to font loading
This release contains some significant changes to the way KeyLines deals with loading fonts.
If you use Font Icons in a production environment you will need to make some changes to your code
before deploying this version of KeyLines.
For reasons of performance, simplicity and compatibility KeyLines now defers to an external font
loader if required. Full information on the changes and a migration guide is available here.
Contact us if you need more information or clarification.
Get started faster with React

We are delighted to announce our new documentation to help you integrate KeyLines into your React
app. A new demo and helpful notes will get you started.
Our React integration is currently in Alpha release. This means we need your feedback before we
recommend using it in production. Send our support team your thoughts.
Note: KeyLines is compatible with most JavaScript frameworks, so you’re welcome to use whichever you
prefer. We don’t prescribe or prefer any of them! If there’s an integration you would like to see
us work on next, just let us know.
An update on WebGL
Thank you for all of your comments and suggestions on our new WebGL functionality. To respond to all
of your feedback, we are going to keep it in Alpha
stage for a little longer – so we recommend you do not use it in production environments yet.
We will update you when WebGL moves into Beta stage.
Other Enhancements
Retina-ready resources
More and more of your users are adopting 4k monitors and retina screens. To give them the best experience
possible, we have released our fixed assets in beautiful better-than-HD resolution.
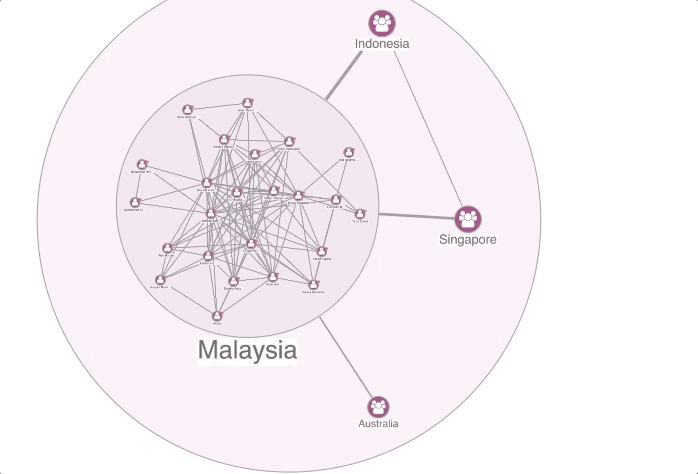
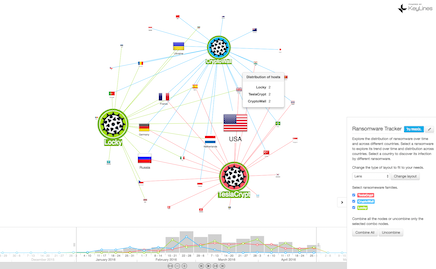
New Combos demo
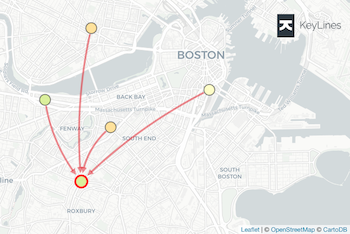
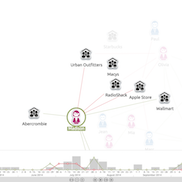
You asked us for more demos to help you make better use of Combos. So our new Ransomware demo lets you explore the spread of ransomware over time and regions, showing how to use KeyLines combos with the time bar component.
New license mechanisms
This release includes some changes ‘under the hood’ that will mean our Proof of Concept customers no
longer need to replace their KeyLines files each month. This will reduce interruption to your projects
and maintenance overhead.
End of Flash Support
We contacted all customers some time ago to warn you of our plans to end support for our Flash component. This release will be the last to support Flash.
By dropping Flash, we will be able to dedicate more time to better and more modern technologies that
your users prefer – including WebGL.
We do have a long-term support option in place for any customers who need to continue supporting Flash,
but you must let us know. Contact our support team with your requirements.
Breaking API changes
See 3.1 Breaking Changes
API changes
- The 'tc' property (text centre) now applies to all nodes, not just shapes
- Glyphs have a new 'e' property specifying their enlargement
- chart.expand has a new 'straighten' option to control whether it straightens links
- The hierarchy and radial layouts now have a 'level' option to control which level nodes are placed in
- chart.options has a new 'truncateLabels' setting that controls how item labels are truncated
Bug fixes and improvements
- Fixed the type parameter of the time bar 'play' event, which was sometimes incorrect
- Corrected the triggering of time bar start events when dragging the sliders
- Stopped Chrome v50 and later generating lots of WebGL warning messages on the developer console
- Fixed an error dragging the time bar sliders with no data loaded
- Made KeyLines map mode respect disabling of double-click zoom on the Leaflet map control
- Fixed a problem which stopped chart.merge adjusting link offsets correctly
- Fixed the extents used by toDataURL when the 'fit' option was 'oneToOne'
- Eliminated a ten-second delay in loading the chart with certain font settings
- Corrected the display of text labels in canvas elements with dir="rtl" in Internet Explorer
- Hovering over a previously-hovered item after clicking the chart background now triggers a new hover event
- Improved the way font icons are drawn to reduce overlap with selection indicators
- Improved how the hierarchy layout handles long node labels with the 'right' and 'left' orientations
3.0 Release Notes23 March 2016
NEW FEATURESENHANCEMENTSBUG FIXESAPI CHANGESDEMO CHANGES
Supercharge your charts with WebGL
Performance boosted to meet cyber-data challenges
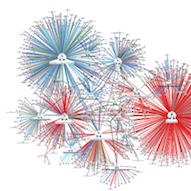
Significant optimizations increase rendering performance by up to 10 times; selected graph functions by up to 50 times. New demos illustrate support for fast-growing Cyber security markets.
 |  |  |
Panning with 10k elements: 10x improvement in FPS | Drawing: 5x improvement in rendering speed | Repeated neighbours calls: 50x improvement |
This release gives access to the power of WebGL, allowing analysts to manipulate bigger graphs more easily.
All users will appreciate greater smoothness and fluidity when panning and zooming.
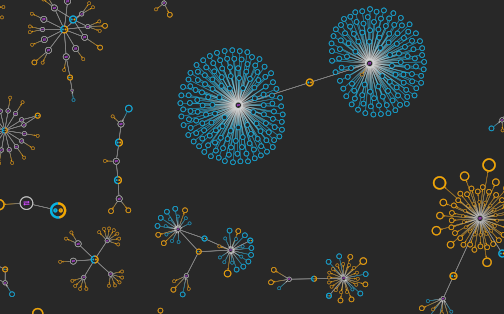
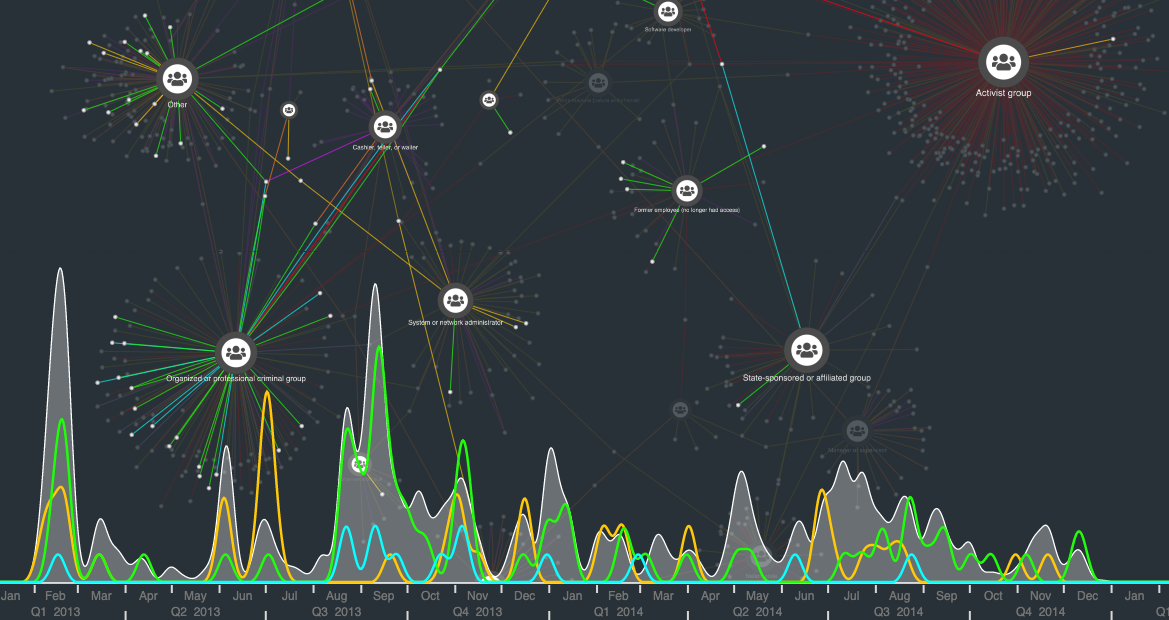
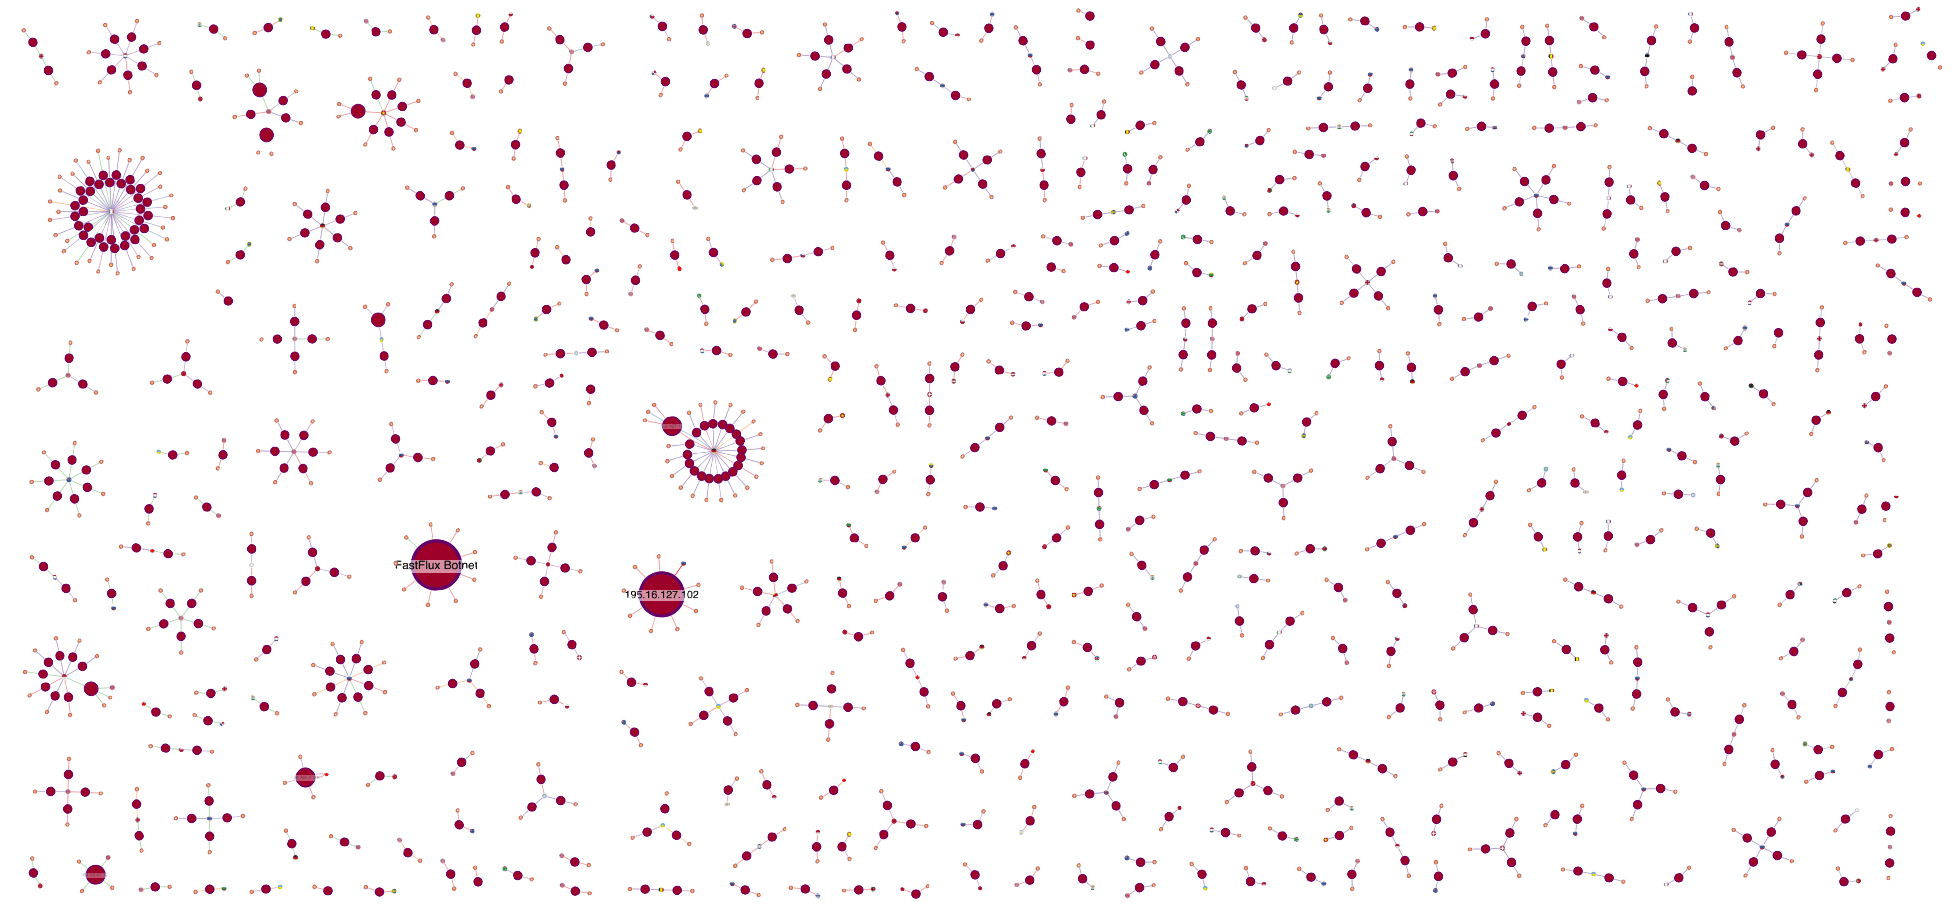
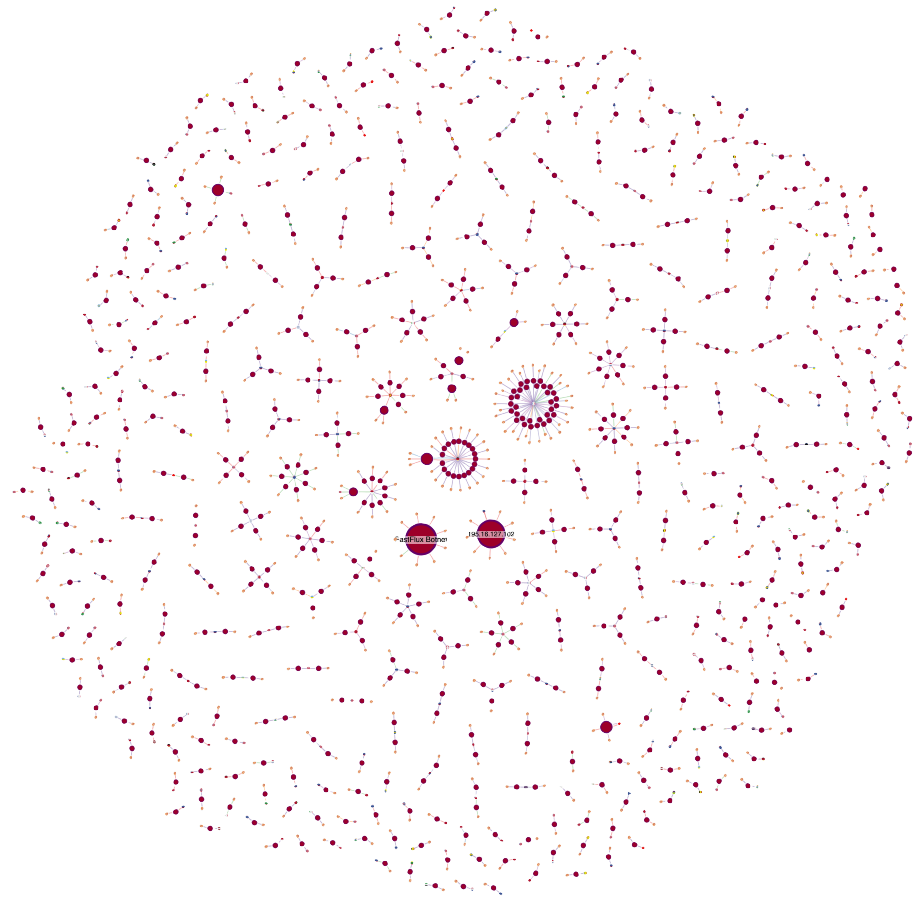
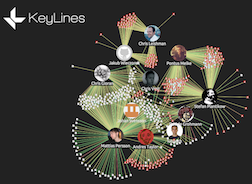
To reinforce our support for ‘Cyber’ we’ve included three compelling new demos showing the insight that
KeyLines can provide. Complex data-breach, malware propagation and vulnerability-exploit data are all
shown to quickly reveal underlying patterns and trends that can inform proactive behaviour.
 | 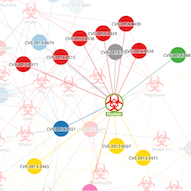 |  |
Malware Tracker | Exploit Kits | Data Breaches |
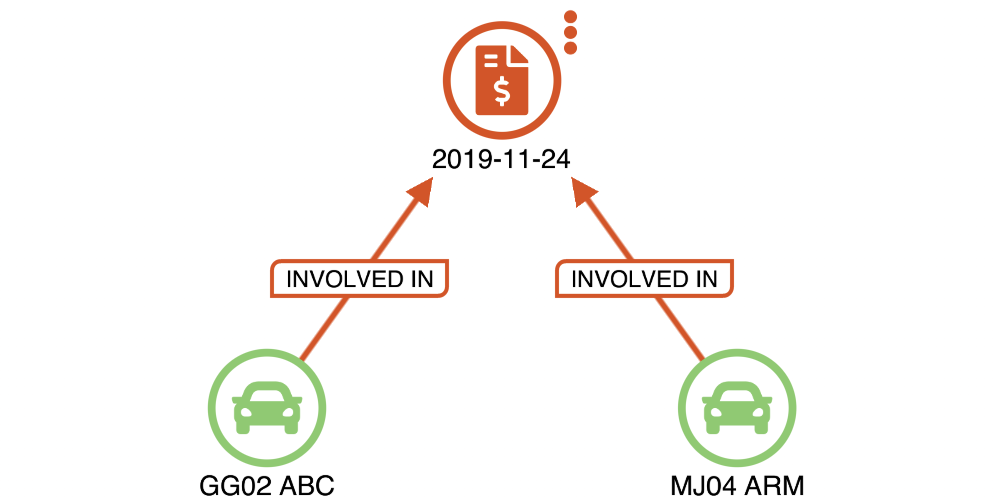
There are brand-new Fraud demos to show the power of KeyLines in exposing suspicious transactions, and, for
developers, there’s a great new demo showing integration with the popular Neo4j database. Here the graph is
combined with the power of KeyLines’ time bar to dynamically pull more data from Neo as the user explores
the data. And, as usual, you can download all the assets behind all the demos with one click to get more
productive, more quickly.
 |  |  |
Neo4J with Time Bar | New Angular Directive | Credit Card Fraud |
To support the increasing number of applications being developed within the Angular framework, we are
delighted to release a brand new directive for KeyLines. This gives a clean and compatible way to access
the power of KeyLines from other Angular components. To support your development we’ve added some fresh
demos and new Angular-specific documentation.
As usual your feedback on the release is really appreciated – we’d particularly like to know what you
value most in this release and what you’d like to see in the future. Email your comments to [email protected].
Harnessing the power of WebGL, and more
KeyLines has always been a high performance, feature rich toolkit. But, increasingly, you have been
asking us to help you visualize bigger networks. There are several discrete areas we’ve focussed on
that combine to make light work of heavy visualisations for those customers with challenging datasets,
while giving valuable headroom for those whose data-volumes are still increasing.
And, in case you’re concerned that it’s going to take effort to exploit these changes in your
application – good news! – we’ve maintained API compatibility, so you’ll see
some dramatic improvements with no code changes.
WebGL – unlocking the power of modern hardwareIn this release, in addition to Canvas and Flash options, we make available the option to use WebGL
for rendering KeyLines assets. WebGL directly offloads calculation to the GPU available in modern PCs,
Laptops and tablets running the vast majority of modern OS and Browser combinations. And, more good news,
no new hardware is required to access this resource!
Graph function optimisationKeyLines’ graph functions are the ‘engine room’ of our code; this is where you explore the graph
structure of your data. Some of these operations are computationally expensive: e.g. the ‘neighbours’
call for a large graph has been relatively time-consuming, but its use is common with large and dense
datasets.
With some clever optimisations, including the dynamic construction of a cache, we see improvements
of around 50-fold when making repeated graph.neighbours calls (average gain benchmarked against our
most challenging data-sets).
WebGL Alpha releaseAs ever, we’ve tested this release very thoroughly on a broad range of devices, and across our usual
suite of OS and browsers. We’re confident in the quality and compatibility of WebGL and encourage you
to experiment with the functionality in the context of your applications.
We’re making this capability available under our Alpha program. Dependent on the feedback we receive
we expect to be able to mature the capability rapidly through 2016.
More control, better controls
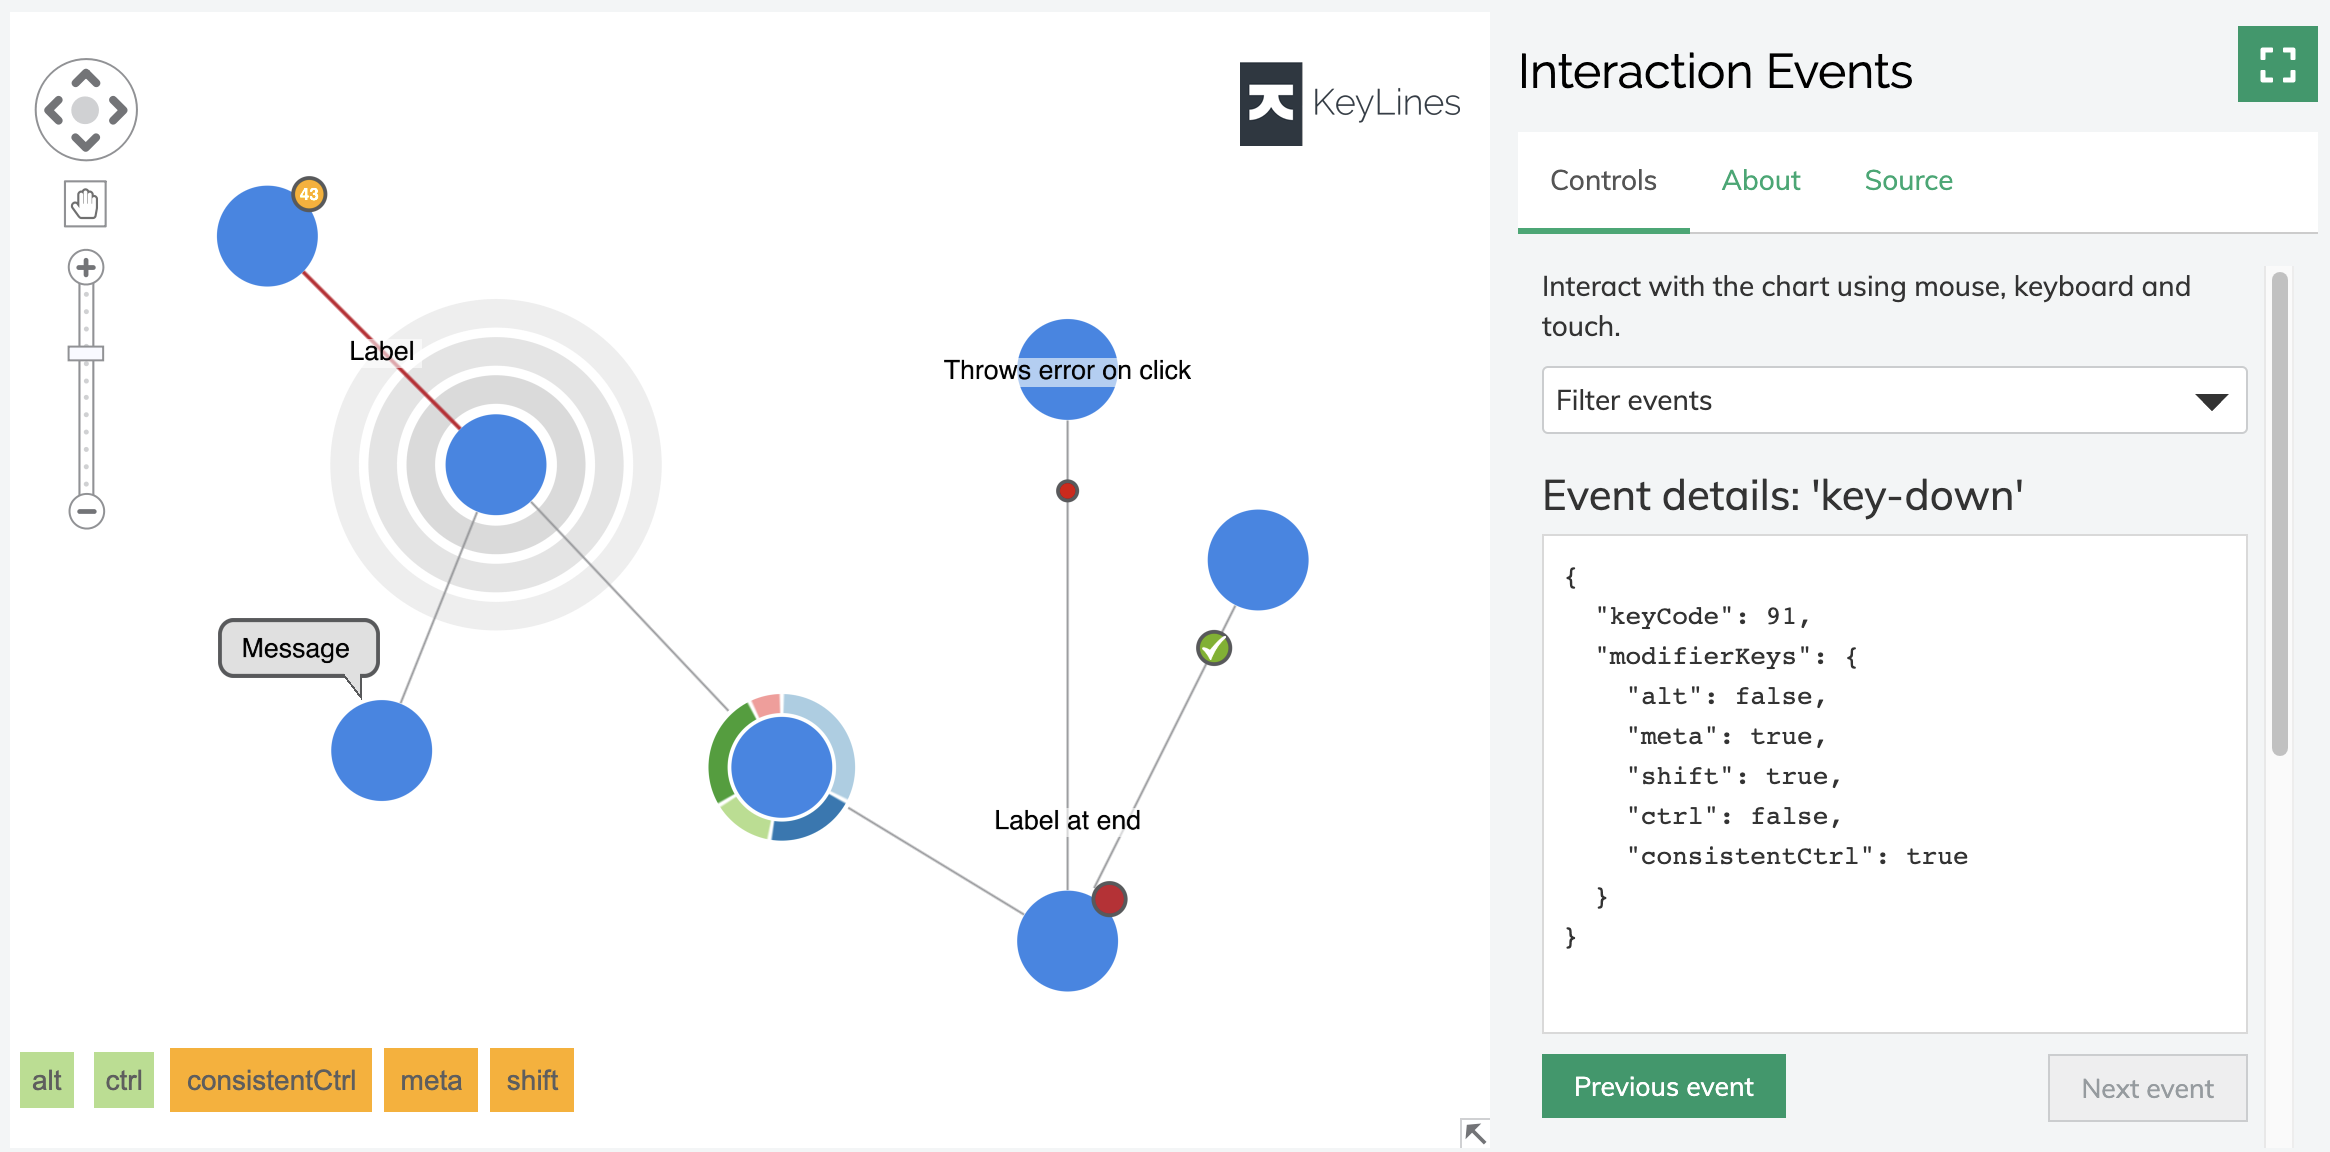
Time bar - new set of events availableKeyLines’ time bar provides a powerful way to interact with data that has time-stamped information
encoded in it. We’ve added a number of new events that give you more customisation and control of
time bar events – e.g. you can now present tool-tips on the control buttons; you can detect more
types of discrete events to allow construction of completely custom controls that blend in seamlessly
with your app.
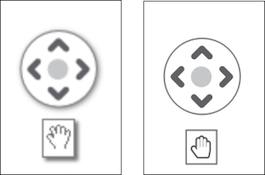
Nav Controls fit in betterAs a response to many requests, we’ve delivered the ability to move our standard navigation controls from
the top left-hand corner of the canvas. You now have flexibility on the placement of the chart along with
the ability to ‘nudge’ the controls to fit in with other assets.
Performance Benchmarks: Details
The figures quoted are average across a range of datasets. We’ve tested on 2014 MacBook Pro with OSX
version 10.11 and Chrome 49. Due to the variation of hardware platforms the achieved performance when
invoking WebGL rendering may vary significantly.
API Changes
- Changes to chart.options:
- Added a setting to the overview option to allow its position to be adjusted.
- Changed the logo and navigation options from strings to objects with properties, to allow their positions
to be adjusted. However, code using string values for these options will work in a backward-compatible way.
- New time bar events: contextmenu, dblclick, dragstart, dragend, dragcomplete, end, flashclick, mousewheel, pause, play and start.
- graph().neigbours has a new 'hops' option to specify how many links away to look for neighbours.
- KeyLines.mode has a new 'webgl' setting to enable WebGL drawing.
- There is a new KeyLines.webGLSupport method which returns whether WebGL drawing is supported on the current device.
Bug Fixes and Improvements
- Fixed a regression related to calling ‘setProperties’ on a node when selecting it would cancel dragging.
- Fixed a bug causing ugly font rendering in Chrome where a minimum font size was not being correctly detected.
- Fixed a bug where dragover event would occasionally not be fired.
- Fixed a bug where mousewheel zoom would stop working after being bound to wheel event handler.
- Updated Angular directive to allow image base path to be adjusted separately.
- Fixed a bug where the time bar major scale would sometimes be missing.
- Fixed a bug where the a single data-point would not show correctly in the time bar.
- Fixed issue where a link with a single arrow head could be reversed after being combined and uncombined.
- Fixed issue where zooming in and out would occasionally displace nodes on map (Geo mode).
- Fixed an interaction between Leaflet and Angular; now correctly allows access to Leaflet map object.

 button
in the top-right corner of each code block.
button
in the top-right corner of each code block.